Author Affiliations
1School of Information and Control Engineering, Xi’an University of Architecture and Technology, Xi’an 710055, Shaanxi , China2Guangdong Artificial Intelligence and Digital Economy Laboratory (Guangzhou), Guangzhou 510320, Guangdong , Chinashow less
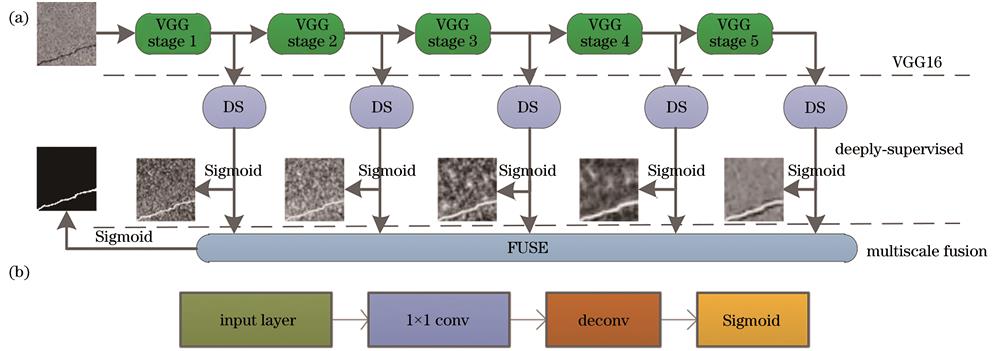
Fig. 1. HEDNet. (a) Structure of HEDNet; (b) structure of deep supervision module
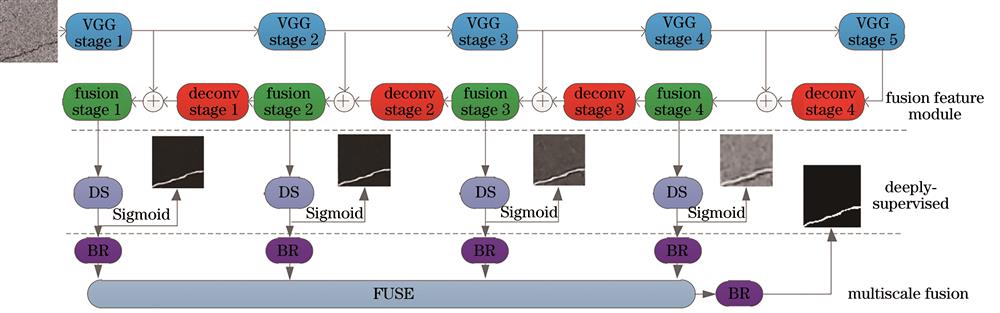
Fig. 2. Structure of CFEHNet model
Fig. 3. Convolution-deconvolution feature fusion module
Fig. 4. Structure of boundary refinement module
Fig. 5. Partial dataset after data enhancement
Fig. 6. Change of training loss value and verification accuracy rate
Fig. 7. Visual comparison between VGG16 and feature fusion module
Fig. 8. Visual comparison of effectiveness of deep supervision module
Fig. 9. Comparison of partial test results of Bridge_Crack_Image_Data
Fig. 10. Comparison of partial test results of CFD
Deconvolution stage | Convolution | Channel | Pool | Output |
---|
conv_5_3 | | 512 | Max,22 | 2M2M | Fuse with conv_4_3 | 11 | 512 | | 2M2M | D4(4_1,4_2,4_3) | 33 | 256 | Max,22 | 4M4M | Fuse with conv_3_3 | 11 | 256 | | 4M4M | D3(3_1,3_2,3_3) | 33 | 128 | Max,22 | 8M8M | Fuse with conv_2_2 | 11 | 128 | | 8M8M | D2(2_1,2_2) | 33 | 64 | Max,22 | 16M16M | Fuse with conv_1_2 | 11 | 64 | | 16M16M | D1(1_1,1_2) | 33 | 64 | | 16M16M |
|
Table 1. Deconvolution network structure and feature fusion parameters
Sample | Predicted positive sample (positive) | Prediction negative sample (negative) |
---|
Actually positive sample (positive) | TP | FN | Actually negative sample (negative) | FP | TN |
|
Table 2. Confusion matrix
Condition | Bridge_Crack_Image_Data | Crack Forest Dataset |
---|
Precision | Recall | F1 | Precision | Recall | F1 |
---|
CFEHNet without stage 1 | 0.8534 | 0.6907 | 0.7634 | 0.8615 | 0.8648 | 0.8631 | CFEHNet without stage 2 | 0.8756 | 0.6913 | 0.7726 | 0.8805 | 0.8845 | 0.8825 | CFEHNet without stage 3 | 0.8942 | 0.6945 | 0.7817 | 0.9058 | 0.9056 | 0.9057 | CFEHNet without stage 4 | 0.9134 | 0.7011 | 0.7932 | 0.9104 | 0.9013 | 0.9060 | CFEHNet | 0.9156 | 0.7063 | 0.7974 | 0.9107 | 0.9022 | 0.9064 |
|
Table 3. Contribution of side network output to result in each stage
Model | Boundary accuracy | Center accuracy | Overall accuracy |
---|
CFEHNet without BR | 0.7138 | 0.9412 | 0.9167 | CFEHNet | 0.7331 | 0.9414 | 0.9214 |
|
Table 4. Comparison experiment of boundary thinning module
Algorithm | Precision | Recall | |
---|
HED[21] | 0.9167 | 0.6503 | 0.7608 | UNet[23] | 0.8945 | 0.6822 | 0.7740 | SegNet[24] | 0.8745 | 0.6887 | 0.7705 | CFEHNet without BR | 0.9156 | 0.7063 | 0.7974 | CFEHNet | 0.9214 | 0.7101 | 0.8021 |
|
Table 5. Comparison of quantitative analysis of Bridge_Crack_Image_Data
Algorithm | Precision | Recall | F1-score |
---|
HED[21] | 0.8656 | 0.8699 | 0.8677 | UNet[23] | 0.8811 | 0.8897 | 0.8854 | SegNet[24] | 0.8816 | 0.8789 | 0.8802 | CFEHNet without BR | 0.9107 | 0.9022 | 0.9064 | CFEHNet | 0.9164 | 0.9062 | 0.9113 |
|
Table 6. Comparison of quantitative analysis of CFD