College of Precision Instrument and Optoelectronics Engineering, Tianjin University; Key Laboratory of Optoelectronic Information Technology, Ministry of Education, Tianjin 300072, China
The spiderlike structures in the photoelectron momentum distributions of ionized electrons from the hydrogen atom are numerically simulated by using a semiclassical rescattering model (SRM) and solving the time-dependent Schr?dinger equation (TDSE), focusing on the role of the phase of the scattering amplitude. With the SRM, we find that the spiderlike legs shift to positions with smaller transverse momentum values while increasing the phase. The spiderlike patterns obtained by SRM and TDSE are in good agreement upon considering this phase. In addition, the time differences in electron ionization and rescattering calculated by SRM and the saddle-point equations are either in agreement or show very similar laws of variation, which further corroborates the significance of the phase of the scattering amplitude.
When an atom interacts with intense laser field[1], electrons will be ionized from the parent ion[2,3]. After tunneling ionization, some electrons leave the parent ion and reach the detector directly, and some electrons are driven back to the parent ion by the laser field and then rescatter off the parent ion. In fact, these two kinds of electrons will give rise to interference in the final photoelectron momentum distributions (PMDs) when their final momenta are equal, and these electrons are also named the reference beam and the signal beam, respectively. The interference process has also been referred to as strong-field photoelectron holography (SFPH)[4], a novel quantum analog of optical holography containing structural and dynamic information in PMDs[5–7]. Being an SFPH, the spiderlike structure in PMDs has been extensively investigated both experimentally and theoretically[8–16]. In 2012, Hickstein et al.[13] intuitively demonstrated that the shape and feature of the spiderlike structure depend on the number of times an electron passes its parent ion before rescattering. Because the spatial and temporal information of both the parent ions and electrons is encoded, the interference patterns have been used to extract structural and dynamic information in recent investigation[17–21]. Particularly, the scattering amplitude, , has been used to characterize the strength of a scattering process, where is the phase of the scattering amplitude induced by the rescattering of the photoelectron with the parent ion. This phase can be of great significance in atomic physics and elementary particle physics[22,23]. In strong-field physics, the phase of the scattering amplitude is related to the structural information encoded in SFPH. In 2016, Zhou et al.[14] utilized a screened Coulomb potential model to extract this phase, and little following research was reported.
In the paper, we present our numerical results on the role of the scattering-amplitude phase in the spiderlike structure by deploying the semiclassical rescattering model (SRM) for hydrogen atoms. With this model, we show that the primary spiderlike structure arises from the interference between the reference electrons and the signal electrons scattered on their first revisit. For comparison, we also present the spiderlike structure simulated by solving the time-dependent Schrödinger equation (TDSE). The simulations show that the interference patterns obtained from the SRM do not agree with the TDSE results if the phase of the scattering amplitude is neglected, and these patterns agree with each other if this phase is included. We find that the time difference between electron ionization and rescattering extracted from SRM agrees fairly well with that calculated from TDSE.
2. Numerical Methods
In order to study the role of phase in the scattering amplitude of the spiderlike structure, we deploy SRM, which is based on the classical recollision three-step model[24–29]. In our simulation, the laser field is linearly polarized along the x axis (in atomic units, a.u.):
Sign up for Chinese Optics Letters TOC. Get the latest issue of Chinese Optics Letters delivered right to you!Sign up now
In SRM, we assume that the initial velocity of the signal electron is zero (i.e., ), while the initial velocity of the reference electron is assumed to be and . At the rescattering time, , the signal electron is driven back to its initial position [i.e., ]. The rescattering time, , can be obtained by solving the equation of motion:
The signal electron is elastically scattered by the parent ion at an angle . In our simulation, the scattering angle is within the range of to . The final momentum of the signal electron can be written aswhere is the velocity of the signal electron at the rescattering time . When the final momentum of the signal electron is equal to that of the reference electron, interference will occur. Given the final momentum value, the ionization time and the initial velocity of the reference electron can be obtained as
The phase of each trajectory is given by the classical action along the path:
In our simulation, the phase difference is given bywhere is the phase of the scattering amplitude, as suggested by the theory deciphering the spiderlike structure[14,15]. Equation (8) can be rewritten in a simple form[14,15]:
From Eq. (9), it is clear that information of and is encoded in the interference patterns of the PMDs.
The and can be approximately determined from the saddle-point equations[30]. The saddle-point equations for the signal electron areand the saddle-point equation for the reference electron is
In Eqs. (10)–(13), and are the electron drift momentum and final momentum, respectively. is the ionization potential of the hydrogen atom. is the vector potential. Equations (10) and (13) stand for energy conservation in the process of tunneling, Eq. (11) is the return condition of signal electron, and Eq. (12) stands for energy conservation when the signal electron rescatters off the parent ion.
In order to obtain the PMDs, we also numerically solve the TDSE. In the length gauge, the TDSE is written in the following form (in a.u.):where is the Coulomb potential softened to avoid singularity and to match the ionization potential of hydrogen. The soft parameter is set to be 0.9.
We use the wavefunction-splitting technique to obtain the PMDs. The wavefunction-splitting technique allows us to reconstruct the external wavefunction in the momentum space and to calculate the photoelectron momentum spectra accurately[31]. According to the wavefunction-splitting technique, the total simulation space is divided into the inner region (), outer region (), and overlapping region (). In the overlapping region, we use an absorbing function to obtain the internal wavefunction and the external wavefunction . The absorbing function is chosen to be
The wavefunctions are related by the following form:
The final PMDs are obtained from the accumulated momentum-space external wavefunction.
3. Results and Discussion
In our numerical simulation, the intensity and wavelength of the laser pulses are varied around and , respectively. The absolute phase of the laser pulse is zero.
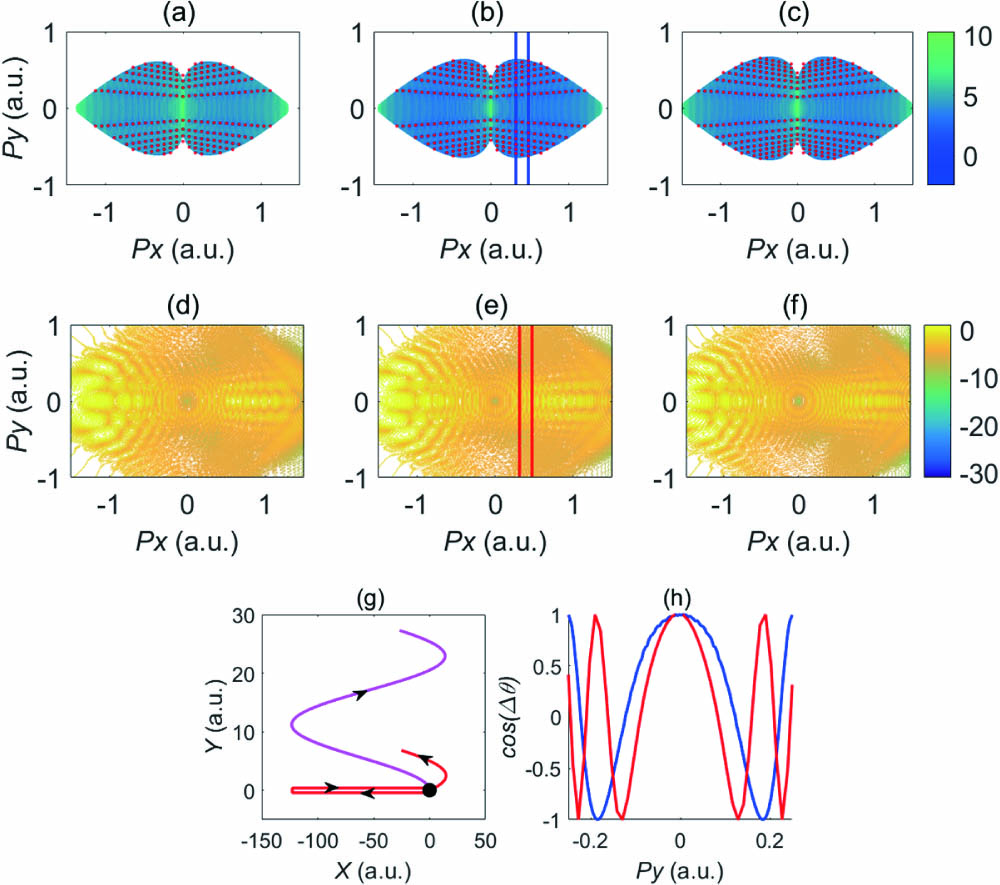
We use the Monte Carlo algorithm in the simulation by sampling electrons ionized within two optical cycles (o.c.), i.e., . Our extensive simulation gives typical spiderlike interference structures, and we choose to show one with in Figs. 1(a)–1(c). In order to demonstrate the feasibility of SRM, we also numerically solve the TDSE to obtain the spiderlike structure, as given in Figs. 1(d)–1(f). One can discern three types of interference patterns in the momentum distributions[32–35]: co-circular rings, short arcs, and spiderlike features. Corresponding to Figs. 1(a)–1(c), we show the reference trajectory and the signal trajectory contributing to the spiderlike feature in Fig. 1(g). We focus on the spiderlike structure in our discussion. One can observe that the spiderlike features in Figs. 1(a)–1(c) resemble those of the TDSE result in Figs. 1(d)–1(f), proving that the overall features obtained by the TDSE are reproduced by the SRM. Therefore, we can use SRM to retrieve the time and spatial information encoded in the holographic spiderlike structure. For making a quantitative comparison, we show, in Fig. 1(h), the cut-plot curves taken along the transverse (py axis) direction at a given longitudinal momentum (at fixed px) in the spiderlike patterns of Figs. 1(a)–1(f). One sees that these two curves do not overlap with each other, which may be attributed to the absence of the Coulomb potential in SRM[27,28]. However, they will overlap if a proper non-zero value of phase is used in the SRM simulation.
Figure 1.Photoelectron momentum distributions of hydrogen atoms simulated by (a)–(c) the semiclassical rescattering model (SRM, is set to zero; red dots on the interference minima are just for guiding the eyes) and (d)–(f) TDSE. Because there are not many optical cycles in the pulse, the TDSE results are asymmetric with respect to the px = 0 axis. The top two panels correspond to wavelengths of (a), (d) , (b), (e) , and (c), (f) , respectively. (g) Typical trajectories that form the spiderlike structure in the SRM: the parent ion is at the origin of the axis. The pink curve is the reference trajectory, and the red curve is the signal trajectory. A scattering angle of is assumed for the signal trajectory. (h) Cut-plot curves taken at px = 0.4 a.u. for the SRM (blue) and TDSE (red), and the cut positions are marked by the colored vertical lines in (b) and (e). Intensity of the laser pulse is I = , and the pulse duration is two optical cycles.
In order to reveal the role of the phase of the scattering amplitude, , in the spiderlike structure and possibly in other interference patterns, we assume that is a constant up to a zeroth-order approximation. In Figs. 2(a)–2(g), we chose to show some typical spiderlike patterns for , , , , , , and , and several cut-plot curves at a.u. in Fig. 2(h). These cut-plot curves are the transverse momentum distributions manifesting that the spiderlike patterns are gradually narrowing in the transverse direction, and the intensities of the zeroth-order interference maxima (central maxima) are decreasing when is increased from zero to . This observation is in agreement with the theoretical prediction of Eq. (9). We take the first interference minimum in the transverse momentum distributions (cut-plot curves) for discussion. Equation (12) can be solved for the transverse momentum values corresponding to the first transverse minimum as . It can be seen that the position of the first interference minimum depends on the value of , and will decrease when increases. As a result, the first interference minimum unambiguously shifts to positions with smaller transverse momentum values. These analyses demonstrate that the phase induced by Coulomb interaction of the signal electron with the parent ion plays an important role in the spiderlike patterns. In addition, Fig. 2(h) shows that the intensities of the zeroth-order interference maxima decrease when increases. However, the reduction of the zeroth-order interference maxima was not reported before, possibly because the phase is small at low momentum and small scattering angle, and the fact that the SRM does not consider the amplitudes of the signal and the reference electrons.
Figure 2.Spiderlike structures numerically obtained by the SRM. The patterns correspond to phase values of (a) , (b) , (c) , (d) , (e) , (f) , and (g) , respectively. (h) Cut-plot curves are taken at px = 0.4 a.u. from the spiderlike patterns in (a) (blue solid curve), (b) (red solid curve), (c) (green solid curve), (d) (black solid curve), (e) (blue dotted curve), (f) (red dotted curve), and (g) (green dotted curve), respectively. The cut positions are marked by the colored vertical lines in (a)–(g). The laser parameters are the same as in Fig. 1.
For investigating the time information pertaining to ionization and rescattering, we use a window function[14] to average the interference fringes over in a narrow interval for a better signal-to-noise ratio and a curve-fitting procedure for the cut-plot curves. By choosing the cut position of a.u. and a suitable window width of a.u., we obtain several cut-plot curves of the interference structures at the fixed . Then, we use the curve-fitting procedure to extract the interference term from these curves. The quantities and encoded in these spiderlike structures are extracted from the interference term by using Eq. (9). Figure 3(b) presents quantity extracted by fitting the cut-plot curves [like those in Fig. 2(h)]; it is clear that the extracted decreases with the increasing final momentum . Then, we compare the extracted with the calculated by the saddle-point equations[30] and show them in Fig. 3(b). Their excellent agreement further demonstrates that this time difference is not the main reason for the disparity of the interference patterns obtained by SRM and TDSE. Quantities extracted by fitting to Eq. (9) and calculated from the saddle-point equations both deviate obviously from the quantity obtained directly by the SRM. Nevertheless, the time difference obtained by these three methods manifests a similar law of linear variation with the final momentum . This monotonic variation of with can explain the shift of the spiderlike feature: with increasing , decreases, leading to an increase of the value at which the first interference minimum is located. As a result, the spiderlike structures become thinner for smaller longitudinal momenta, which are in agreement with the appearance of the interference patterns in Figs. 1(a)–1(f).
Figure 3.(a) Blue area presents the tunneling time range of signal electron wavepackets and reference electron wavepackets involved in the spiderlike structures. The red curve presents the rescattering time range of signal electron wavepackets. (b) Variations of the time difference between rescattering of the signal electron and ionization of the reference electron with px. The red circles, blue circles, and black pluses represent the time difference extracted by fitting the cut-plot curves of the spiderlike structure using Eq. (9), the time differences obtained by the SRM, and the time differences calculated by the saddle-point equations, respectively.
We also monitor variations of higher-order interference fringes, or more spider legs, with the phase by studying how the positions, or the transverse momentum values at which the first, second, and third interference minima are located, shift with . To that end, we obtain the cut-plot curves at a cut position of a.u. in the spiderlike patterns [as shown in Fig. 4(a)], then we compare the interference minimum positions, , extracted by fitting to Eq. (9) with that calculated from the SRM, and the result is shown in Fig. 4(b). It is obvious that these two kinds of values are in good agreement because the phase is taken into account. With the increase of the phase of the scattering amplitude, the position of the interference minimum decreases to smaller transverse momenta, and thus the shift of the spiderlike structure becomes appreciable, which corroborates our previous analysis on the first interference minimum. These observations also reveal that SRM is powerful in elucidating SFPH.
Figure 4.(a) Cut-plot curves are taken at px = 0.4 a.u. from the spiderlike patterns corresponding to (blue curve), (red curve), (green curve), and (black curve), respectively. The first, second, and third interference minimum positions are marked by black dotted circles. (b) Variations of the interference minimum positions (values of transverse momenta or py) of the cut-plot curves taken at px = 0.4 a.u. with . The first, second, and third interference minimum positions calculated using Eq. (9) are marked by blue circles. For comparison, the corresponding positions calculated by the SRM are shown by red pluses, red crosses, and red star symbols.
To further study the impact of the phase of the scattering amplitude in the spiderlike structure, we use a fitting algorithm[14] to extract the value of phase from the cut-plot curves of the spiderlike patterns simulated by TDSE, and the results are presented in Fig. 5(a). One can see that is close to zero when a.u., and thus the zeroth-order interference maximum will not decrease in intensity. Then, we use the value of phase extracted from the TDSE results to obtain a modified cut-plot curve of the spiderlike structure simulated by SRM combining with Eq. (9), and this curve is given in Fig. 5(b). Clearly, the modified curve agrees well with that obtained by the TDSE, simply because we have included both the phase difference between the signal electron and the reference electron accumulated during their propagation and the phase of the scattering amplitude.
Figure 5.(a) Values of phase extracted from the cut-plot curves simulated by TDSE, plotted as a function of py. (b) Cut-plot curves taken at px = 0.4 a.u. The red dashed curve represents the curve obtained from TDSE. The blue solid curve represents the modified results of Fig. 1(a) after considering a phase value given in Fig. 5(a) in SRM.
In summary, by deploying SRM for hydrogen atoms, we have successfully simulated the spiderlike structure in PMDs and proven that the spiderlike structure well reproduces that by TDSE upon considering the phase of the scattering amplitude. Analyses on the cut-plot curves taken from the spiderlike patterns for interrogating the role of the phase have demonstrated their significance in deciphering the spiderlike interference patterns. Our simulation shows that the spiderlike feature shifts to positions of smaller transverse momentum values with increasing . The time differences in electron ionization and rescattering calculated by SRM and the saddle-point equations are either in agreement or show similar laws of linear variation, thus strengthening the reliability of the SRM and corroborating the significance of the phase of the scattering amplitude in spiderlike PMDs.