
Xing Tong, Danhua Cao, Yubin Wu, Xingru Jiang. Button Defect-Free Image Reconstruction and Defect Detection Algorithm Based on Low-Rank Information[J]. Acta Optica Sinica, 2019, 39(1): 0115002
- Acta Optica Sinica
- Vol. 39, Issue 1, 0115002 (2019)
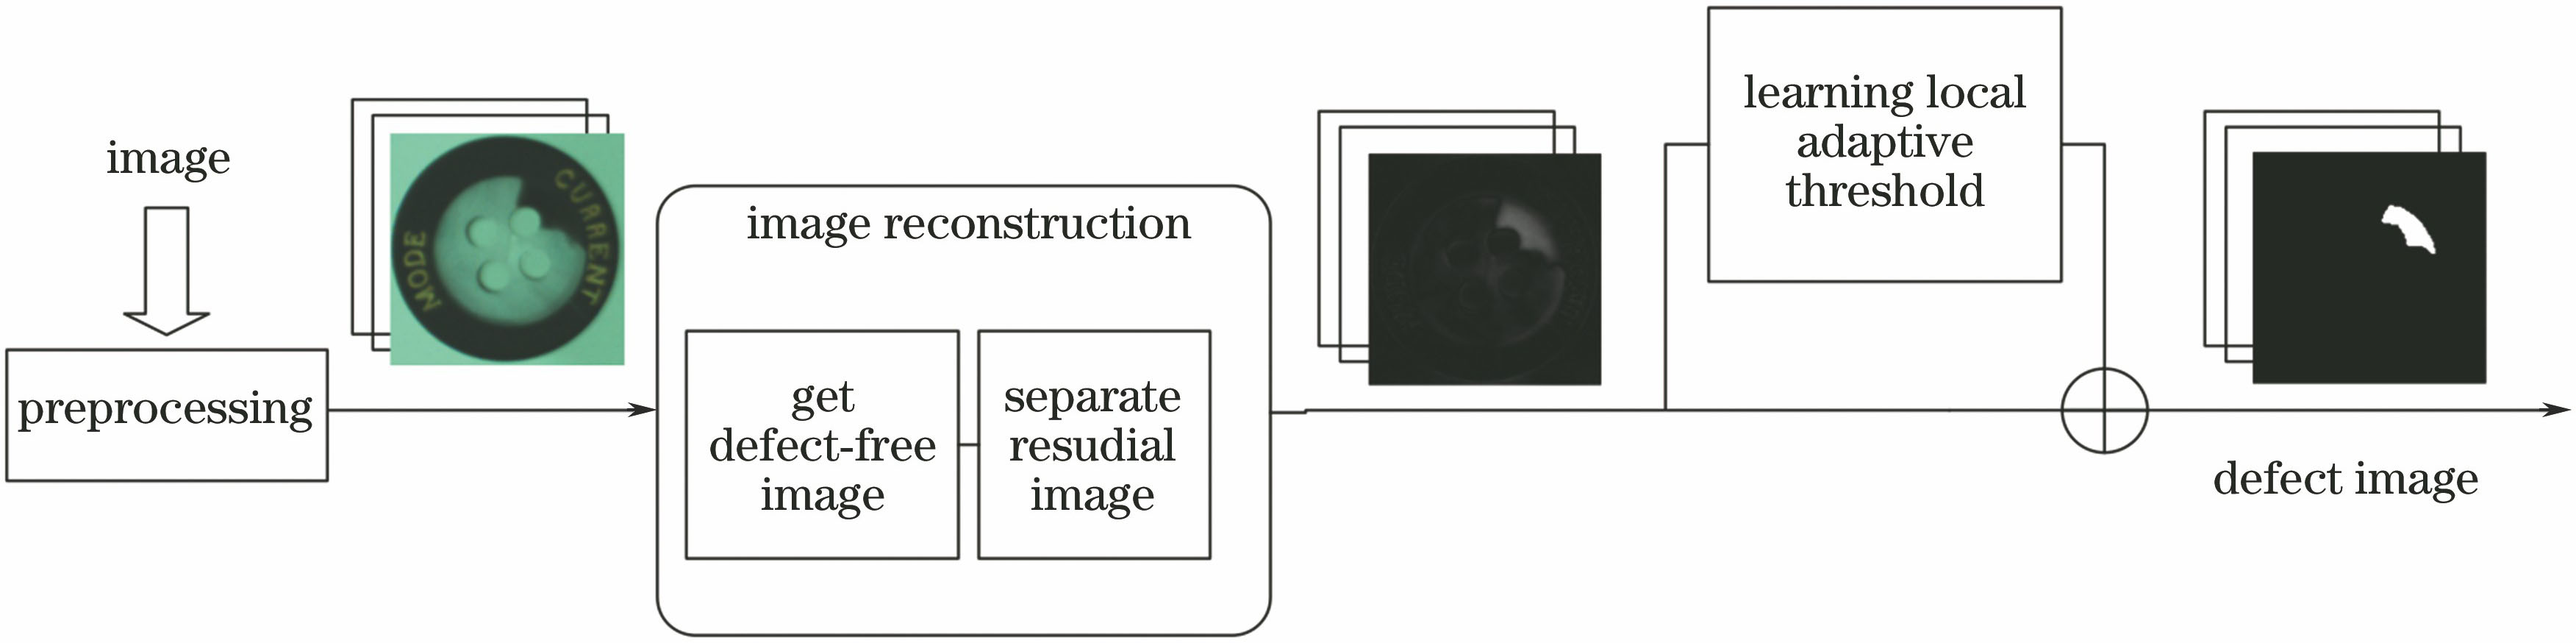
Fig. 1. Block diagram of defect detection algorithm
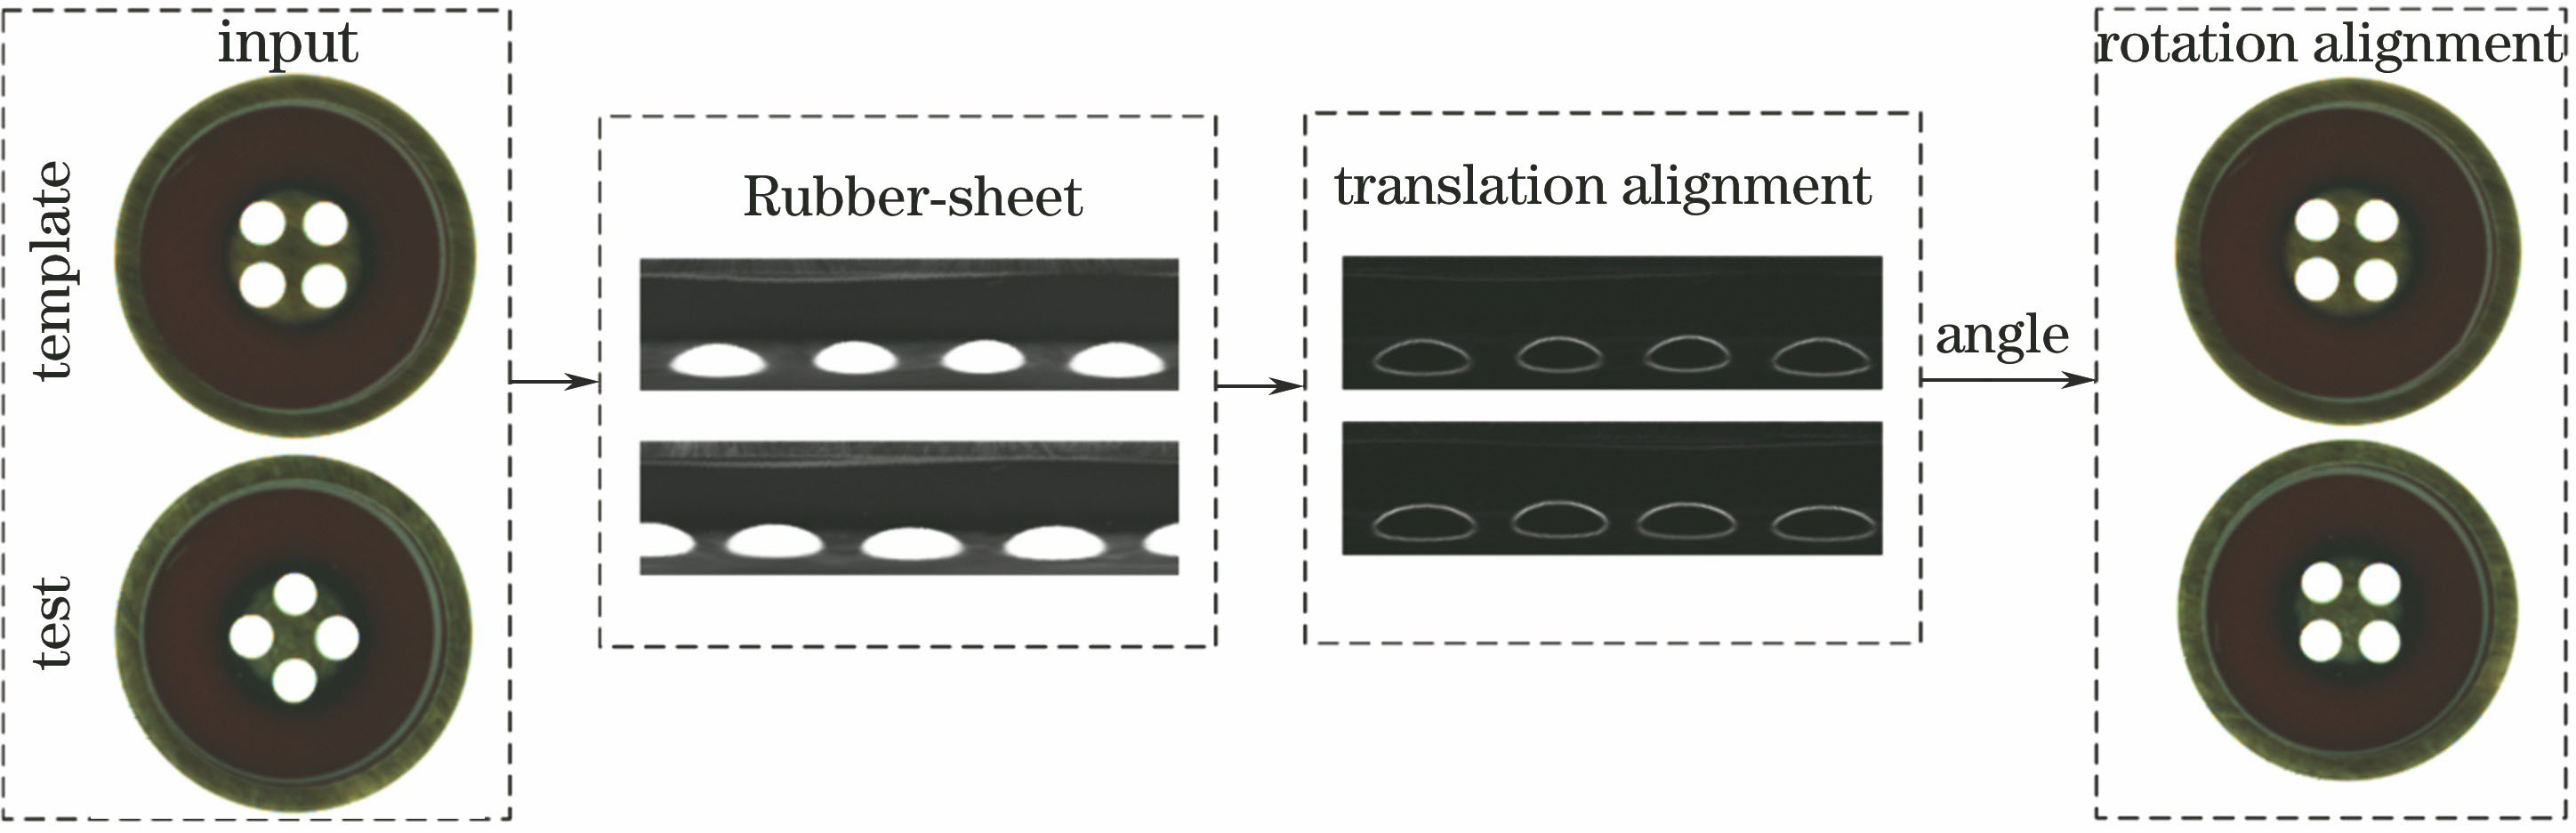
Fig. 2. Flow chart of image preprocessing and its effect
Fig. 3. Button defect-free image reconstruction and residual image with defects. (a) Original image; (b) defect-free image; (c) residual image
Fig. 4. Pixel value distribution of original and residual images. (a) Original image; (b) residual image
Fig. 5. (a) Residual image; (b) binary image
Fig. 6. Result diagrams of different defection methods. (a1)-(a3) Original images of three samples; (b1)-(b3) results by background substraction method; (c1)-(c3) results by linear regression method; (d1)-(d3) results by proposed method
Fig. 7. ROC curves by proposed method
Fig. 8. Effect of different parameter C on detection effect. (a) Original image; (b) detection effect at C=1; (c) detection effect at C=3; (d) detection effect at C=6
Fig. 9. Recognition rate of algorithm versus illumination
|
Table 1. Detail information of test samples
| |||||||||||||||||||||||||||||||||||||||||||||||||||||||||||
Table 2. Results by different methods
|
Table 3. Correspondence between light source scale and actual light intensity

Set citation alerts for the article
Please enter your email address
© Copyright 2018-2021 | Chinese Laser Press. All Rights Reserved 沪ICP备15018463号-20