Author Affiliations
1 Information Science and Technology College, Dalian Maritime University, Dalian, Liaoning 116026, China2 State Key Laboratory of Integrated Services Networks, Xi'an, Shannxi 710071, China3 Key Laboratory of Spectral Imaging Technology, Chinese Academy of Sciences, Xi'an, Shannxi 710071, Chinashow less
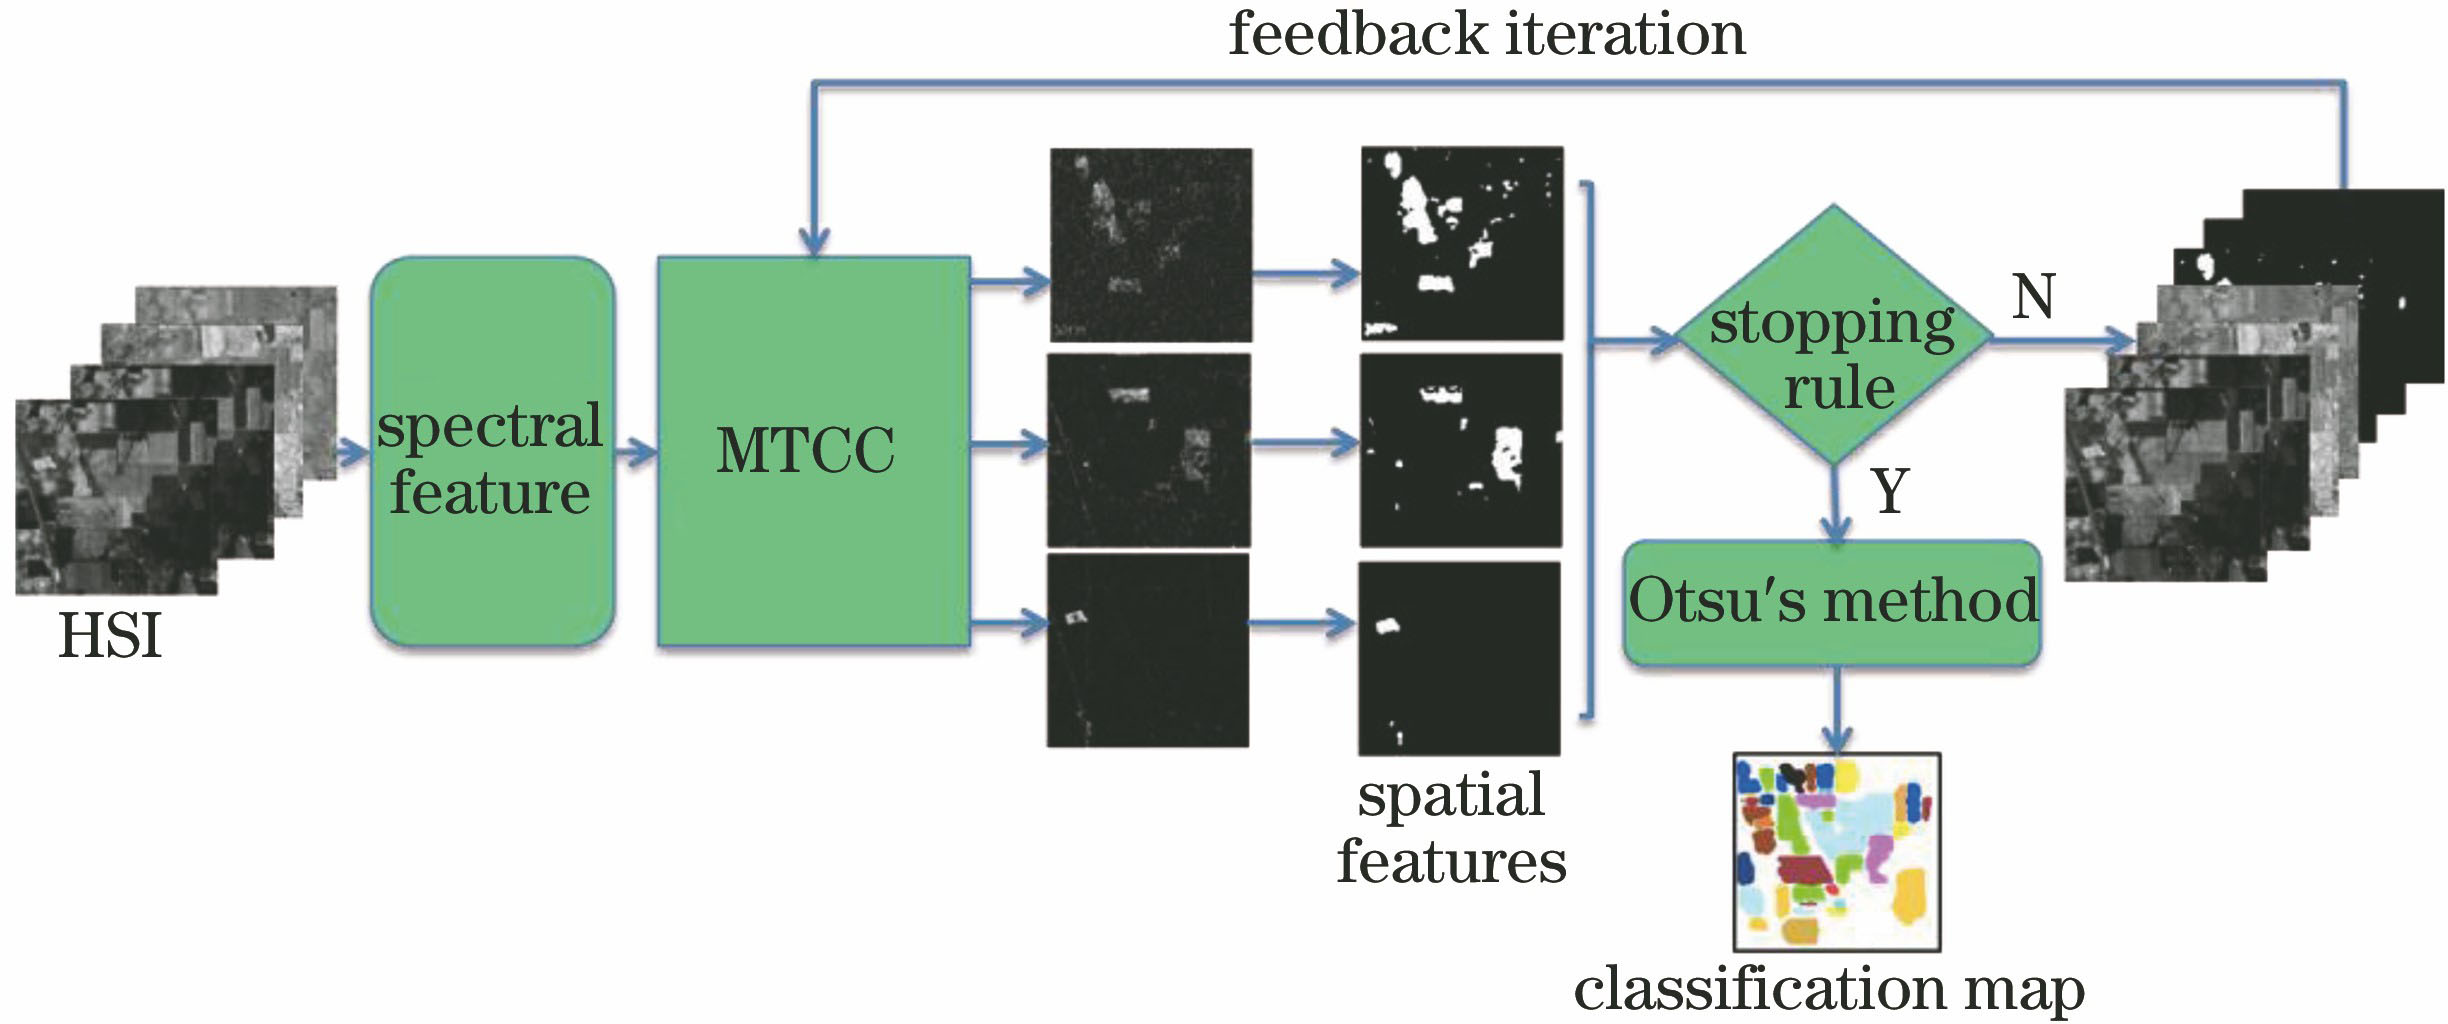
Fig. 1. Flow chart of classification method
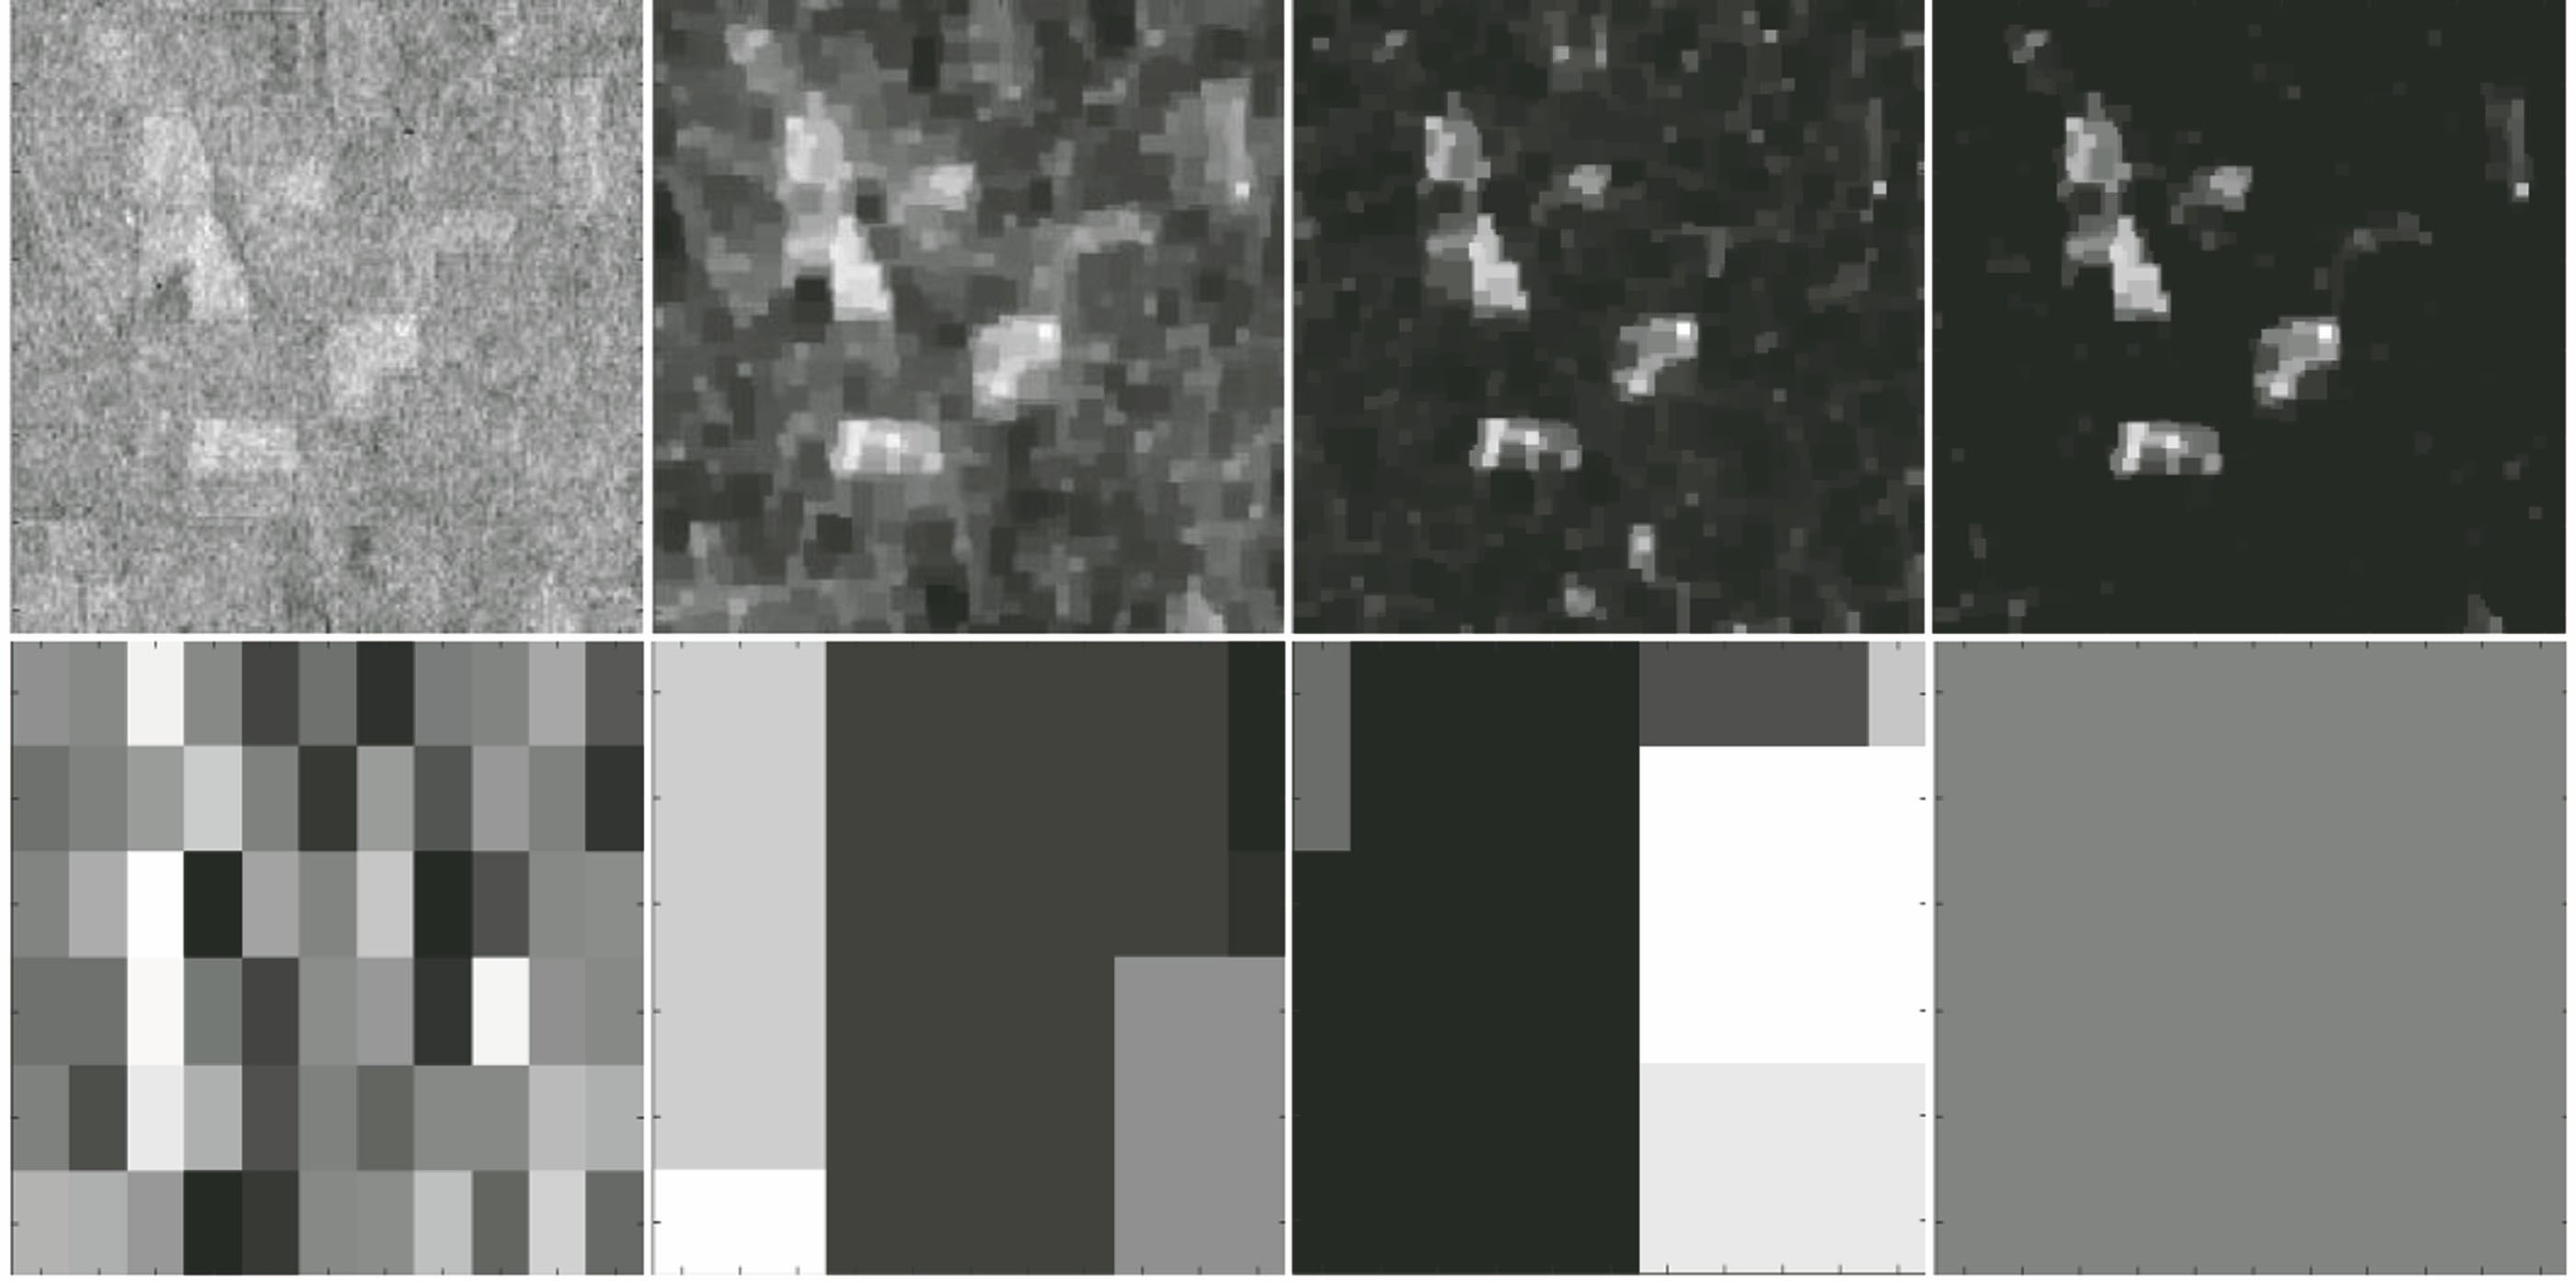
Fig. 2. Comparison of feedback stack methods
Fig. 3. Image of Purdue. (a) False color image; (b) image of ground truth
Fig. 4. Classification results of Purdue data by MTCC-1 method. (a) Iteration for 1 time; (b) iteration for 2 times; (c) iteration for 5 times; (d) final result
Fig. 5. Classification results of Purdue data by MTCC-2 method. (a) Iteration for 1 time; (b) iteration for 2 times; (c) iteration for 5 times; (d) final result
Fig. 6. Image of Salinas Valley. (a) False color image; (b) image of ground truth
Fig. 7. Classification results of Salinas data by MTCC-1 method. (a) Iteration for 1 time; (b) iteration for 2 times; (c) iteration for 5 times; (d) final result
Fig. 8. Classification results of Salinas data by MTCC-2 method. (a) Iteration for 1 time; (b) iteration for 2 times; (c) iteration for 5 times; (d) final result
Fig. 9. Image of Pavia University. (a) False color image; (b) image of ground truth
Fig. 10. Classification results of Pavia data by MTCC-1 method. (a) Iteration for 1 time; (b) iteration for 2 times; (c) iteration for 5 times; (d) final result
Fig. 11. Classification results of Pavia data by MTCC-2 method. (a) Iteration for 1 time; (b) iteration for 2 times; (c) iteration for 5 times; (d) final result
| Classification result | Real result |
|---|
| C1 | C2 | … | Cn | BKG |
|---|
| C1 | n11 | n12 | … | n1n | n1B | | C2 | n21 | n22 | … | n2n | n2B | | ︙ | ︙ | ︙ | ︙ | ︙ | ︙ | | Cn | nn1 | nn2 | … | nnn | nnB | | BKG | nB1 | nB2 | … | nBn | nBB |
|
Table 1. Confusion matrix of C-class classification results
| Label | Class name | Sample |
|---|
| Class 1 | Alfalfa | 46 | | Class 2 | Corn-notill | 1428 | | Class 3 | Corn-min | 830 | | Class 4 | Corn | 237 | | Class 5 | Grass/pasture | 483 | | Class 6 | Grass/trees | 730 | | Class 7 | Grass/pasture-mowed | 28 | | Class 8 | Hay-windrowed | 478 | | Class 9 | Oats | 20 | | Class 10 | Soybeans-notill | 972 | | Class 11 | Soybeans-min | 2455 | | Class 12 | Soybeans-clean | 593 | | Class 13 | Wheat | 205 | | Class 14 | Woods | 1265 | | Class 15 | Bldg-grass green-drives | 386 | | Class 16 | Stone-steel towers | 93 | | BKG | Background | 10776 |
|
Table 2. Category name and pixel number of Purdue image
| Class | MTCC-1 | MTCC-2 | EPF-B-g | EPF-B-c | EPF-G-g | EPF-G-c |
|---|
| Ci,OA | Ci,Pre | Ci,OA | Ci,Pre | Ci,OA | Ci,Pre | Ci,OA | Ci,Pre | Ci,OA | Ci,Pre | Ci,OA | Ci,Pre |
|---|
| 1 | 91.30 | 97.67 | 95.65 | 95.65 | 100.00 | 57.50 | 97.83 | 57.69 | 97.83 | 58.44 | 100.00 | 60.53 | | 2 | 97.76 | 94.58 | 97.69 | 91.96 | 85.01 | 67.03 | 84.94 | 66.91 | 85.22 | 67.09 | 84.45 | 65.76 | | 3 | 99.40 | 93.96 | 98.80 | 92.34 | 93.13 | 74.40 | 94.10 | 73.54 | 92.41 | 73.12 | 92.41 | 74.11 | | 4 | 100.00 | 99.16 | 100.00 | 99.58 | 99.16 | 64.74 | 99.16 | 64.56 | 99.16 | 60.26 | 99.16 | 59.95 | | 5 | 97.10 | 94.94 | 93.79 | 95.77 | 93.58 | 39.65 | 93.37 | 41.45 | 94.00 | 42.23 | 93.58 | 43.55 | | 6 | 97.40 | 95.05 | 98.63 | 91.25 | 100.00 | 49.06 | 99.73 | 48.92 | 99.73 | 46.82 | 100.00 | 48.70 | | 7 | 100.00 | 100.00 | 100.00 | 100.00 | 96.43 | 62.79 | 96.43 | 65.85 | 96.43 | 56.25 | 96.43 | 56.25 | | 8 | 99.58 | 99.37 | 99.58 | 100.00 | 100.00 | 69.88 | 100.00 | 70.40 | 100.00 | 71.77 | 100.00 | 71.34 | | 9 | 100.00 | 64.52 | 100.00 | 62.50 | 95.00 | 38.78 | 100.00 | 42.55 | 100.00 | 55.56 | 95.00 | 63.33 | | 10 | 97.53 | 93.03 | 97.53 | 90.46 | 82.30 | 62.70 | 82.82 | 61.97 | 81.79 | 62.21 | 82.51 | 62.51 | | 11 | 98.78 | 95.62 | 98.37 | 94.19 | 95.23 | 76.71 | 95.64 | 76.63 | 94.46 | 77.02 | 94.70 | 77.45 | | 12 | 96.96 | 94.73 | 96.80 | 97.95 | 98.82 | 62.47 | 98.65 | 63.38 | 98.48 | 61.67 | 98.65 | 61.13 | | 13 | 98.54 | 98.54 | 97.07 | 98.51 | 99.02 | 79.61 | 99.02 | 77.19 | 99.51 | 76.69 | 99.51 | 73.12 | | 14 | 97.55 | 97.70 | 95.57 | 96.95 | 98.26 | 31.91 | 98.50 | 31.58 | 98.10 | 31.90 | 98.50 | 31.97 | | 15 | 97.15 | 98.17 | 99.74 | 98.72 | 96.63 | 7.85 | 96.89 | 7.94 | 94.30 | 7.67 | 99.48 | 7.99 | | 16 | 96.77 | 95.74 | 96.77 | 96.77 | 96.77 | 54.88 | 98.92 | 57.86 | 100.00 | 52.25 | 100.00 | 52.54 | | AO | 98.09 | 97.70 | 94.83 | 95.33 | 94.99 | 94.60 | | P | 96.84 | 96.00 | 46.23 | 46.47 | 46.31 | 46.12 |
|
Table 3. Comparison of classification evaluation results of Purdue data with different methods%
| Label | Class name | Sample |
|---|
| Class 1 | Weed 1 | 2009 | | Class 2 | Weed 2 | 3726 | | Class 3 | Fallow | 1976 | | Class 4 | Fallow rough plow | 1394 | | Class 5 | Fallow smooth | 2678 | | Class 6 | Stubble | 3959 | | Class 7 | Celery | 3579 | | Class 8 | Grapes untrained | 11271 | | Class 9 | Soil vineyard develop | 6203 | | Class 10 | Corn | 3278 | | Class 11 | Lettuce 4 weeks | 1068 | | Class 12 | Lettuce 5 weeks | 1927 | | Class 13 | Lettuce 6 weeks | 916 | | Class 14 | Lettuce 7 weeks | 1070 | | Class 15 | Vineyard untrained | 7268 | | Class 16 | Vineyard trellis | 1807 | | BKG | Background | 56975 |
|
Table 4. Category name and pixel number of Salinas image
| Class | MTCC-1 | MTCC-2 | EPF-B-g | EPF-B-c | EPF-G-g | EPF-G-c |
|---|
| Ci,OA | Ci,Pre | Ci,OA | Ci,Pre | Ci,OA | Ci,Pre | Ci,OA | Ci,Pre | Ci,OA | Ci,Pre | Ci,OA | Ci,Pre |
|---|
| 1 | 98.61 | 93.22 | 99.15 | 90.46 | 100.00 | 73.19 | 100.00 | 74.05 | 100.00 | 74.00 | 100.00 | 71.22 | | 2 | 98.28 | 95.22 | 99.06 | 94.01 | 100.00 | 56.22 | 99.97 | 56.21 | 100.00 | 56.72 | 100.00 | 54.67 | | 3 | 92.91 | 92.73 | 95.24 | 88.69 | 100.00 | 12.20 | 100.00 | 12.22 | 100.00 | 12.13 | 100.00 | 12.10 | | 4 | 94.12 | 85.47 | 94.62 | 83.75 | 100.00 | 23.13 | 100.00 | 23.25 | 100.00 | 23.04 | 100.00 | 22.64 | | 5 | 95.22 | 86.03 | 96.34 | 85.63 | 98.51 | 55.95 | 98.36 | 55.66 | 98.47 | 56.29 | 98.84 | 57.61 | | 6 | 98.81 | 89.97 | 99.27 | 89.32 | 100.00 | 81.75 | 100.00 | 81.18 | 100.00 | 81.58 | 100.00 | 80.65 | | 7 | 98.44 | 89.87 | 99.39 | 88.35 | 100.00 | 79.34 | 100.00 | 80.14 | 100.00 | 80.21 | 99.97 | 79.48 | | 8 | 98.97 | 95.61 | 98.05 | 94.88 | 81.52 | 87.11 | 81.47 | 86.84 | 82.37 | 88.33 | 83.52 | 88.82 | | 9 | 94.97 | 96.70 | 94.23 | 96.50 | 99.85 | 35.25 | 99.84 | 35.33 | 99.87 | 35.19 | 99.87 | 34.90 | | 10 | 95.79 | 95.88 | 96.03 | 94.93 | 96.19 | 28.06 | 96.06 | 27.77 | 96.49 | 27.96 | 97.86 | 30.16 | | 11 | 94.10 | 93.75 | 95.32 | 89.85 | 100.00 | 23.57 | 99.91 | 23.58 | 100.00 | 23.71 | 100.00 | 24.09 | | 12 | 96.94 | 90.59 | 97.82 | 90.36 | 100.00 | 27.42 | 100.00 | 27.36 | 100.00 | 27.20 | 100.00 | 27.23 | | 13 | 97.38 | 76.96 | 96.83 | 76.27 | 99.13 | 67.16 | 99.45 | 67.38 | 99.56 | 66.91 | 99.78 | 66.52 | | 14 | 97.57 | 83.92 | 98.60 | 82.17 | 100.00 | 65.97 | 100.00 | 65.64 | 100.00 | 65.40 | 100.00 | 67.85 | | 15 | 98.35 | 98.18 | 96.86 | 96.89 | 93.82 | 76.17 | 93.26 | 75.86 | 94.32 | 76.86 | 96.19 | 77.94 | | 16 | 97.68 | 92.80 | 98.56 | 92.23 | 99.61 | 69.47 | 99.56 | 69.19 | 99.39 | 70.35 | 99.67 | 70.38 | | AO | 97.33 | 97.29 | 95.87 | 95.70 | 96.01 | 96.55 | | P | 95.32 | 94.81 | 46.71 | 46.63 | 46.77 | 47.04 |
|
Table 5. Comparison of classification evaluation results of Salinas data with different methods%
| Label | Class name | Sample |
|---|
| Class 1 | Asphalt | 6631 | | Class 2 | Meadows | 18649 | | Class 3 | Gravel | 2099 | | Class 4 | Trees | 3064 | | Class 5 | Painted metal sheets | 1345 | | Class 6 | Bare soil | 5029 | | Class 7 | Bitumen | 1330 | | Class 8 | Self-blocking bricks | 3682 | | Class 9 | Shadows | 947 | | BKG | Background | 164624 |
|
Table 6. Category name and pixel number of Pavia image
| Class | MTCC-1 | MTCC-2 | EPF-B-g | EPF-B-c | EPF-G-g | EPF-G-c |
|---|
| Ci,OA | Ci,Pre | Ci,OA | Ci,Pre | Ci,OA | Ci,Pre | Ci,OA | Ci,Pre | Ci,OA | Ci,Pre | Ci,OA | Ci,Pre |
|---|
| 1 | 83.56 | 32.66 | 85.06 | 23.00 | 97.07 | 18.28 | 97.10 | 18.20 | 96.53 | 18.56 | 96.95 | 18.72 | | 2 | 85.05 | 85.17 | 84.63 | 76.47 | 98.10 | 36.51 | 98.09 | 36.48 | 98.13 | 37.10 | 98.16 | 37.42 | | 3 | 80.04 | 42.60 | 76.46 | 33.66 | 91.47 | 34.19 | 91.71 | 34.55 | 91.76 | 35.11 | 91.81 | 35.02 | | 4 | 83.86 | 22.37 | 84.93 | 19.18 | 95.04 | 10.03 | 93.99 | 9.93 | 94.35 | 10.21 | 98.14 | 10.69 | | 5 | 99.12 | 61.43 | 98.03 | 60.02 | 100.00 | 42.92 | 100.00 | 44.42 | 100.00 | 41.81 | 100.00 | 44.63 | | 6 | 85.41 | 89.91 | 88.24 | 85.92 | 100.00 | 9.69 | 100.00 | 9.74 | 100.00 | 9.73 | 100.00 | 9.72 | | 7 | 87.37 | 70.25 | 85.29 | 66.51 | 100.00 | 39.82 | 100.00 | 39.19 | 100.00 | 40.82 | 100.00 | 41.34 | | 8 | 82.03 | 27.09 | 90.52 | 22.79 | 99.02 | 19.19 | 98.72 | 19.23 | 98.91 | 19.28 | 99.51 | 19.31 | | 9 | 80.15 | 24.55 | 73.22 | 19.06 | 100.00 | 9.41 | 100.00 | 9.15 | 100.00 | 7.44 | 100.00 | 7.00 | | AO | 84.68 | 85.43 | 98.97 | 98.95 | 98.84 | 99.17 | | P | 79.13 | 71.44 | 20.41 | 20.41 | 20.39 | 20.45 |
|
Table 7. Comparison of classification evaluation results of Pavia data with different methods%