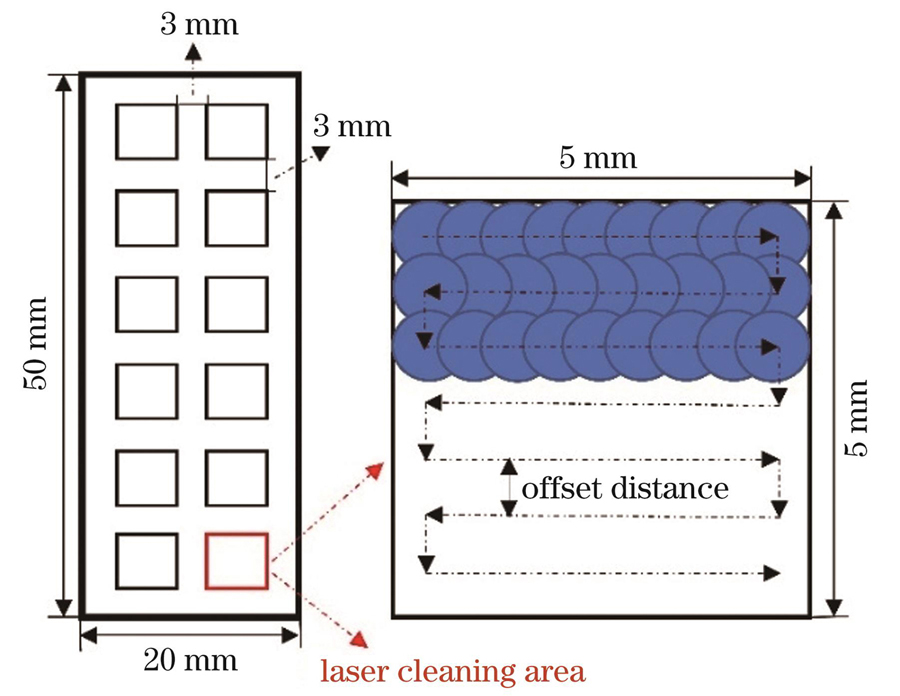
Fig. 1. Schematic of scanning path of laser paint removal
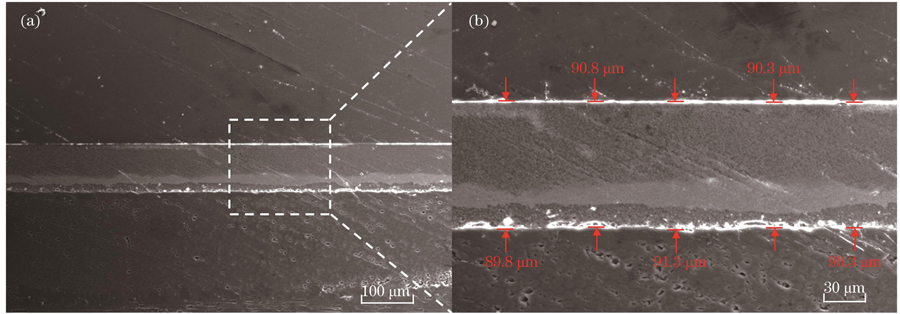
Fig. 2. Epoxy primer on sample surface. (a) Paint thickness distribution; (b) morphology of paint
Fig. 3. Comparison of actual and predicted values. (a) Fiber exposure percentage E; (b) single pulse paint removal depth D; (c) ten-point height of microcosmic irregularity Rz
Fig. 4. Effect of interaction of different factors on fiber exposure percentage
Fig. 5. Effect of laser power and repetition frequency on fiber exposure percentage. (a) Contour plot; (b) response surface plot
Fig. 6. Effect of scanning speed and repetition frequency on fiber exposure percentage. (a) Contour plot; (b) response surface plot
Fig. 7. Effect of laser power and scanning speed on fiber exposure percentage. (a) Contour plot; (b) response surface plot
Fig. 8. Effect of interaction of different factors on single-pulse paint removal depth
Fig. 9. Effect of laser power and repetition frequency on single-pulse paint removal depth. (a) Contour plot; (b) response surface plot
Fig. 10. Effect of scanning speed and repetition frequency on single-pulse paint removal depth. (a) Contour plot; (b) response surface plot
Fig. 11. Effect of scanning speed and laser power on single-pulse paint removal depth. (a) Contour plot; (b) response surface plot
Fig. 12. Influence of interaction of different factors on ten-point height of microcosmic irregularity
Fig. 13. Effect of laser power and repetition frequency on ten-point height of microcosmic irregularity. (a) Contour plot; (b) response surface plot
Fig. 14. Influence of scanning speed and repetition frequency on ten-point height of microcosmic irregularity. (a) Contour map;
Fig. 15. Effect of scanning speed and laser power on ten-point height of microcosmic irregularity. (a) Contour plot; (b) response surface plot
Fig. 16. Laser paint removal sample. (a) SEM morphology of sample surface with residual paint; (b) SEM morphology of complete paint removal surface; (c) three-dimensional morphology
Technical parameter | Numerical value |
---|
Laser wavelength /nm | 1064 | Maximum laser power Pmax /W | 20 | Single pulse energy e /mJ | <1 | Pulse width /ns | 110-140 | Repetition frequency f /kHz | 20-80 | Scanning speed v /(mm·s-1) | <12000 | Focal length /mm | 160 | Spot diameter /μm | 20 | Operating voltage /V | 220 | Minimum line width /mm | 0.02 | Marking range /(mm×mm) | 100×100 | Total power /W | ≤500 |
|
Table 1. Main technical parameters of laser paint removal system
Factor | Level |
---|
Low | Medium | High |
---|
Laser scanning speed v /(mm·s-1) | 130 | 165 | 200 | Laser power P /W | 11 | 13 | 15 | Laser repetition frequency f /kHz | 20 | 50 | 80 |
|
Table 2. Response surface optimization test input factors and level design
No. | Parameter | | Result |
---|
v /(mm·s-1) | P /W | f /kHz | E /% | D /(μm·pulse-1) | Rz /μm |
---|
1 | 200 | 11 | 50 | | 0 | 3.39 | 40.16 | 2 | 200 | 13 | 20 | | 0.027 | 41.49 | 42.02 | 3 | 200 | 15 | 50 | | 0.017 | 11.87 | 40.81 | 4 | 200 | 13 | 80 | | 0 | 3.21 | 58.63 | 5 | 130 | 13 | 20 | | 0.185 | 42.20 | 120.12 | 6 | 165 | 13 | 50 | | 0.007 | 9.86 | 50.33 | 7 | 165 | 13 | 50 | | 0.003 | 8.06 | 53.97 | 8 | 130 | 13 | 80 | | 0.012 | 4.71 | 52.43 | 9 | 165 | 13 | 50 | | 0.005 | 8.40 | 51.15 | 10 | 165 | 15 | 80 | | 0.015 | 5.84 | 45.03 | 11 | 165 | 13 | 50 | | 0.027 | 8.61 | 58.80 | 12 | 165 | 15 | 20 | | 0.163 | 49.98 | 116.73 | 13 | 165 | 13 | 50 | | 0.042 | 9.24 | 59.20 | 14 | 165 | 11 | 20 | | 0.019 | 30.71 | 47.76 | 15 | 165 | 11 | 80 | | 0 | 1.05 | 45.03 | 16 | 130 | 11 | 50 | | 0 | 3.47 | 62.03 | 17 | 130 | 15 | 50 | | 0.148 | 22.78 | 76.91 |
|
Table 3. Response surface optimization test design matrix and test results
Source | Sum of squares | Degree of freedom | Mean square | F-value | p-value |
---|
Model | 0.0589 | 9 | 0.0065 | 30.69 | <0.0001 | v | 0.0113 | 1 | 0.0113 | 52.87 | 0.0002 | P | 0.0131 | 1 | 0.0131 | 61.61 | 0.0001 | f | 0.0167 | 1 | 0.0167 | 78.51 | <0.0001 | vP | 0.0042 | 1 | 0.0042 | 19.84 | 0.0030 | vf | 0.0053 | 1 | 0.0053 | 24.82 | 0.0016 | Pf | 0.0041 | 1 | 0.0041 | 19.45 | 0.0031 | f 2 | 0.0024 | 1 | 0.0024 | 11.04 | 0.0127 | Residual | 0.0015 | 7 | 0.0002 | | | Lack of fit | 0.0003 | 3 | 0.0001 | 0.4045 | 0.7585 | Pure error | 0.0011 | 4 | 0.0003 | | | Cor total | 0.0604 | 16 | | | |
|
Table 4. Analysis of variance of mathematical model of E
Source | Sum of squares | Degree of freedom | Mean square | F-value | p-value |
---|
Model | 3946.15 | 9 | 438.46 | 220.23 | <0.0001 | v | 21.79 | 1 | 21.79 | 10.95 | 0.0130 | P | 336.14 | 1 | 336.14 | 168.84 | <0.0001 | f | 2796.48 | 1 | 2796.48 | 1404.63 | <0.0001 | vP | 29.37 | 1 | 29.37 | 14.75 | 0.0064 | Pf | 52.39 | 1 | 52.39 | 26.32 | 0.0014 | f 2 | 689.14 | 1 | 689.14 | 346.14 | <0.0001 | Residual | 13.94 | 7 | 1.99 | | | Lack of fit | 11.88 | 3 | 3.96 | 7.73 | 0.0386 | Pure error | 2.05 | 4 | 0.5128 | | | Cor total | 3960.09 | 16 | | | |
|
Table 5. Analysis of variance of mathematical model of D
Source | Sum of squares | Degree of freedom | Mean square | F-value | p-value |
---|
Model | 7987.31 | 6 | 1331.22 | 12.22 | 0.0004 | v | 2108.80 | 1 | 2108.80 | 19.36 | 0.0013 | P | 892.70 | 1 | 892.70 | 8.20 | 0.0169 | f | 1968.91 | 1 | 1968.91 | 18.08 | 0.0017 | vf | 1777.00 | 1 | 1777.00 | 16.32 | 0.0024 | Pf | 1189.25 | 1 | 1189.25 | 10.92 | 0.0080 | Residual | 1089.07 | 10 | 108.91 | | | Lack of fit | 1019.78 | 6 | 169.96 | 9.81 | 0.0223 | Pure error | 69.29 | 4 | 10.0732 | | | Cor total | 9076.38 | 16 | | | |
|
Table 6. Analysis of variance of mathematical model of Rz
Technical parameter | Criteria | Weight |
---|
Goal | Lower limit | Upper limit |
---|
Laser scanning speed v /(mm·s-1) | In range | 130 | 200 | 1 | Laser power P /W | In range | 11 | 15 | 1 | Laser repetition frequency f /kHz | In range | 20 | 80 | 1 | Fiber exposure percentage E /% | Maximization | 0.04 | 0.15 | 1 | Single-pulse paint removal depth D /(μm·pulse-1) | Maximization | 30 | 50 | 1 | Ten-piont height of microcosmic irregularity Rz /μm | In range | 45 | 55 | 1 |
|
Table 7. Optimization criteria and weight
No. | v /(mm·s-1) | /% | f /kHz | E /% | D /(μm·pulse-1) | Rz /μm | Desirability |
---|
1 | 200.00 | 71.83 | 20 | 0.060 | 45.32 | 55.00 | 0.369 | 2 | 199.27 | 71.49 | 20 | 0.059 | 45.07 | 54.99 | 0.361 | 3 | 199.99 | 71.68 | 20 | 0.059 | 45.20 | 54.63 | 0.360 | 4 | 198.31 | 71.04 | 20 | 0.059 | 44.74 | 55.00 | 0.352 |
|
Table 8. Optimization results