
Xing-hu FU, Zhen-xing WANG, Shuang-yu MA, Fei ZHAO, Xin LU, Guang-wei FU, Wa JIN, Wei-hong BI. Preparation and Properties of Micro-Cavity Silver Modified Fiber SERS Probe[J]. Spectroscopy and Spectral Analysis, 2021, 41(9): 2800
- Spectroscopy and Spectral Analysis
- Vol. 41, Issue 9, 2800 (2021)
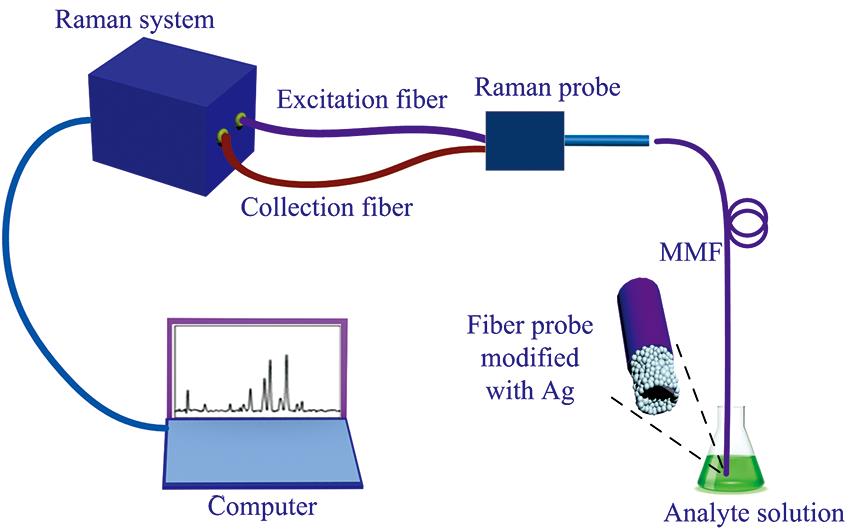
Fig. 1. Experimental device for SERS spectrum detection of micro-cavity fiber probe
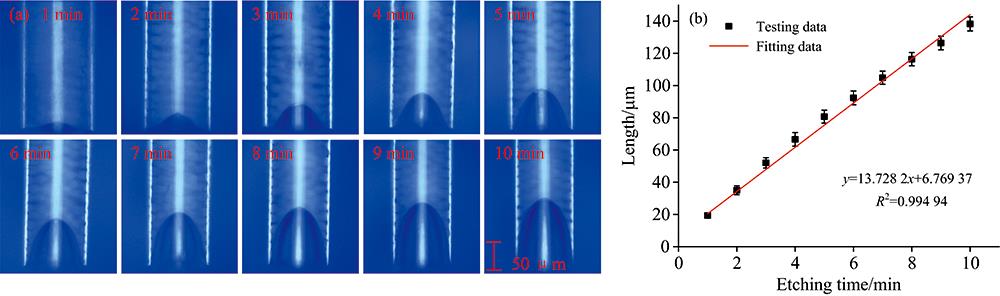
Fig. 2. The change of micro-cavity length with etching time
(a): Microscope image; (b): Quantitative result figure
(a): Microscope image; (b): Quantitative result figure
Fig. 3. Experimental results of the mixed solution to find the best enhancement effect
(a): Raman spectra of nano silver sol and R6G solutions mixed with different mix orders and ratios;(b): Raman intensity of different mixed solutions at Raman shift of 1 510 cm-1
(a): Raman spectra of nano silver sol and R6G solutions mixed with different mix orders and ratios;(b): Raman intensity of different mixed solutions at Raman shift of 1 510 cm-1
Fig. 4. Micro-cavity fiber SERS experiment results
(a): SERS results of optical fiber micro-cavity with different etching time;(b): Raman intensity of fiber micro-cavity with different etching time at Raman shift of 1 510 cm-1
(a): SERS results of optical fiber micro-cavity with different etching time;(b): Raman intensity of fiber micro-cavity with different etching time at Raman shift of 1 510 cm-1
Fig. 5. The active fiber tip modified with silver nanoparticles by magnetron sputtering method modified with silver nanoparticles by magnetron sputtering method
Fig. 6. Probe performance results
(a): Sensitivity test; (b): Linear relationship between logI and logC centered at 1 362 cm-1 in Raman spectrum
(a): Sensitivity test; (b): Linear relationship between log
Fig. 7. Experimental results
(a): Reproducibility test of fiber SERS probe; (b): Raman spectra of fiber probe and bare fiber
(a): Reproducibility test of fiber SERS probe; (b): Raman spectra of fiber probe and bare fiber
|
Table 1. Linear relationships between R6G concentrations and Raman intensities at characteristic peaks of R6G
|
Table 2. RSD values at different major peaks of R6G
|
Table 3. AEFs of the Raman band centered at 1 184, 1 311, 1 362, 1 575 and 1 651 cm-1

Set citation alerts for the article
Please enter your email address
© Copyright 2018-2021 | Chinese Laser Press. All Rights Reserved 沪ICP备15018463号-20