• Photonics Research
  • Vol. 11, Issue 12, 2000 (2023)
Wenxiong Xu1、†, Yuanyuan Li2、†, Qiannan Cui1、5、*, He Zhang1, Chuansheng Xia1, Hao Guo1, Guangquan Zhou1, Jianhua Chang2, Hui Zhao3, Jun Wang4, Zhongze Gu1, and Chunxiang Xu1、6、*
Author Affiliations
  • 1State Key Laboratory of Bioelectronics, School of Biological Science and Medical Engineering, Southeast University, Nanjing 210096, China
  • 2School of Electronic and Information Engineering, Nanjing University of Information Science and Technology, Nanjing 210044, China
  • 3Department of Physics and Astronomy, The University of Kansas, Lawrence, Kansas 66045, USA
  • 4Laboratory of Micro-Nano Optoelectronic Materials and Devices, Key Laboratory of Materials for High-Power Laser, Shanghai Institute of Optics and Fine Mechanics, Chinese Academy of Sciences, Shanghai 201800, China
  • 5e-mail: qiannan@seu.edu.cn
  • 6e-mail: xcxseu@seu.edu.cn
  • show less
    DOI: 10.1364/PRJ.491805 Cite this Article Set citation alerts
    Wenxiong Xu, Yuanyuan Li, Qiannan Cui, He Zhang, Chuansheng Xia, Hao Guo, Guangquan Zhou, Jianhua Chang, Hui Zhao, Jun Wang, Zhongze Gu, Chunxiang Xu. All-optical generation, detection, and manipulation of picosecond acoustic pulses in 2D semiconductor/dielectric heterostructures[J]. Photonics Research, 2023, 11(12): 2000 Copy Citation Text show less
    Physical scheme. All optical generation and detection of picosecond acoustic pulses via (a) upper interface excitation and (b) lower interface excitation. (c) Causality scheme and physical observable detected.
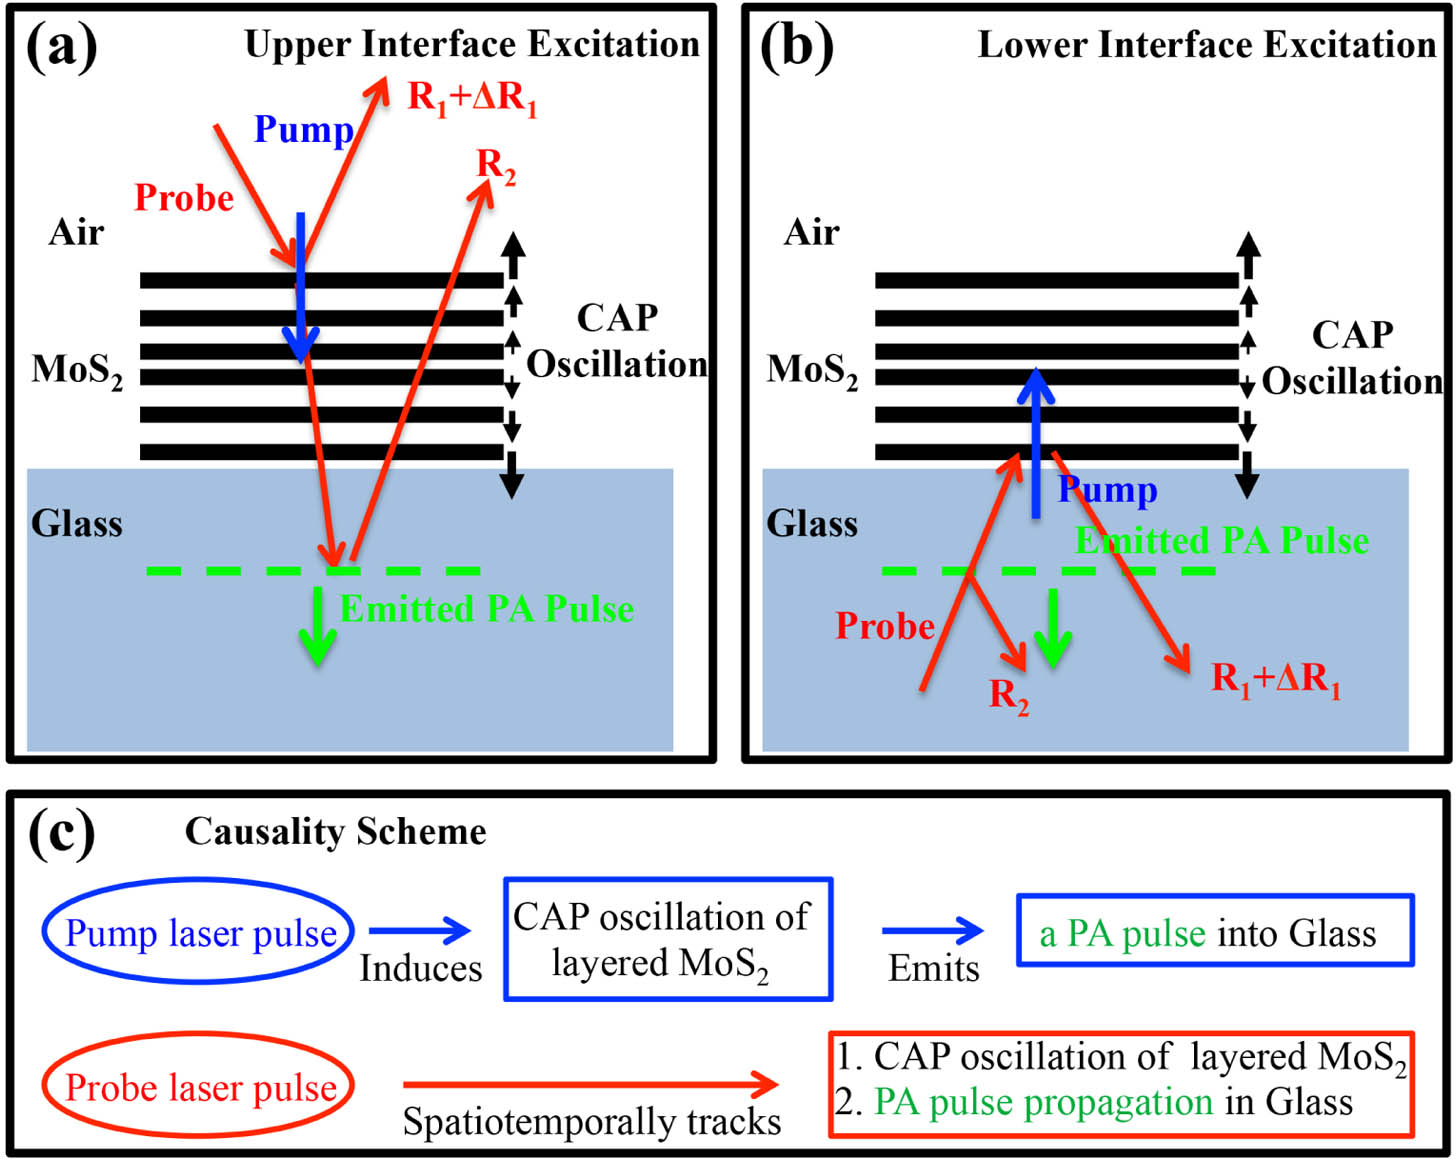
    Fig. 1. Physical scheme. All optical generation and detection of picosecond acoustic pulses via (a) upper interface excitation and (b) lower interface excitation. (c) Causality scheme and physical observable detected.
    Sample information and time-resolved probe differential reflection signals. (a) Optical absorptance of multilayer MoS2 on K9 glass substrate. Inset is the optical microscopic image with a scale bar of 10 μm. (b) AFM profile of the MoS2 sample along the black arrow in (a). (c), (d) Measured differential reflections of probe as a function of time delay under various pump fluences through upper and lower interface excitations, respectively. Pump fluences of colored curves were increased from 55.16 μJ/cm2 (bottom) to 551.6 μJ/cm2 (top) with a step size of 55.16 μJ/cm2.
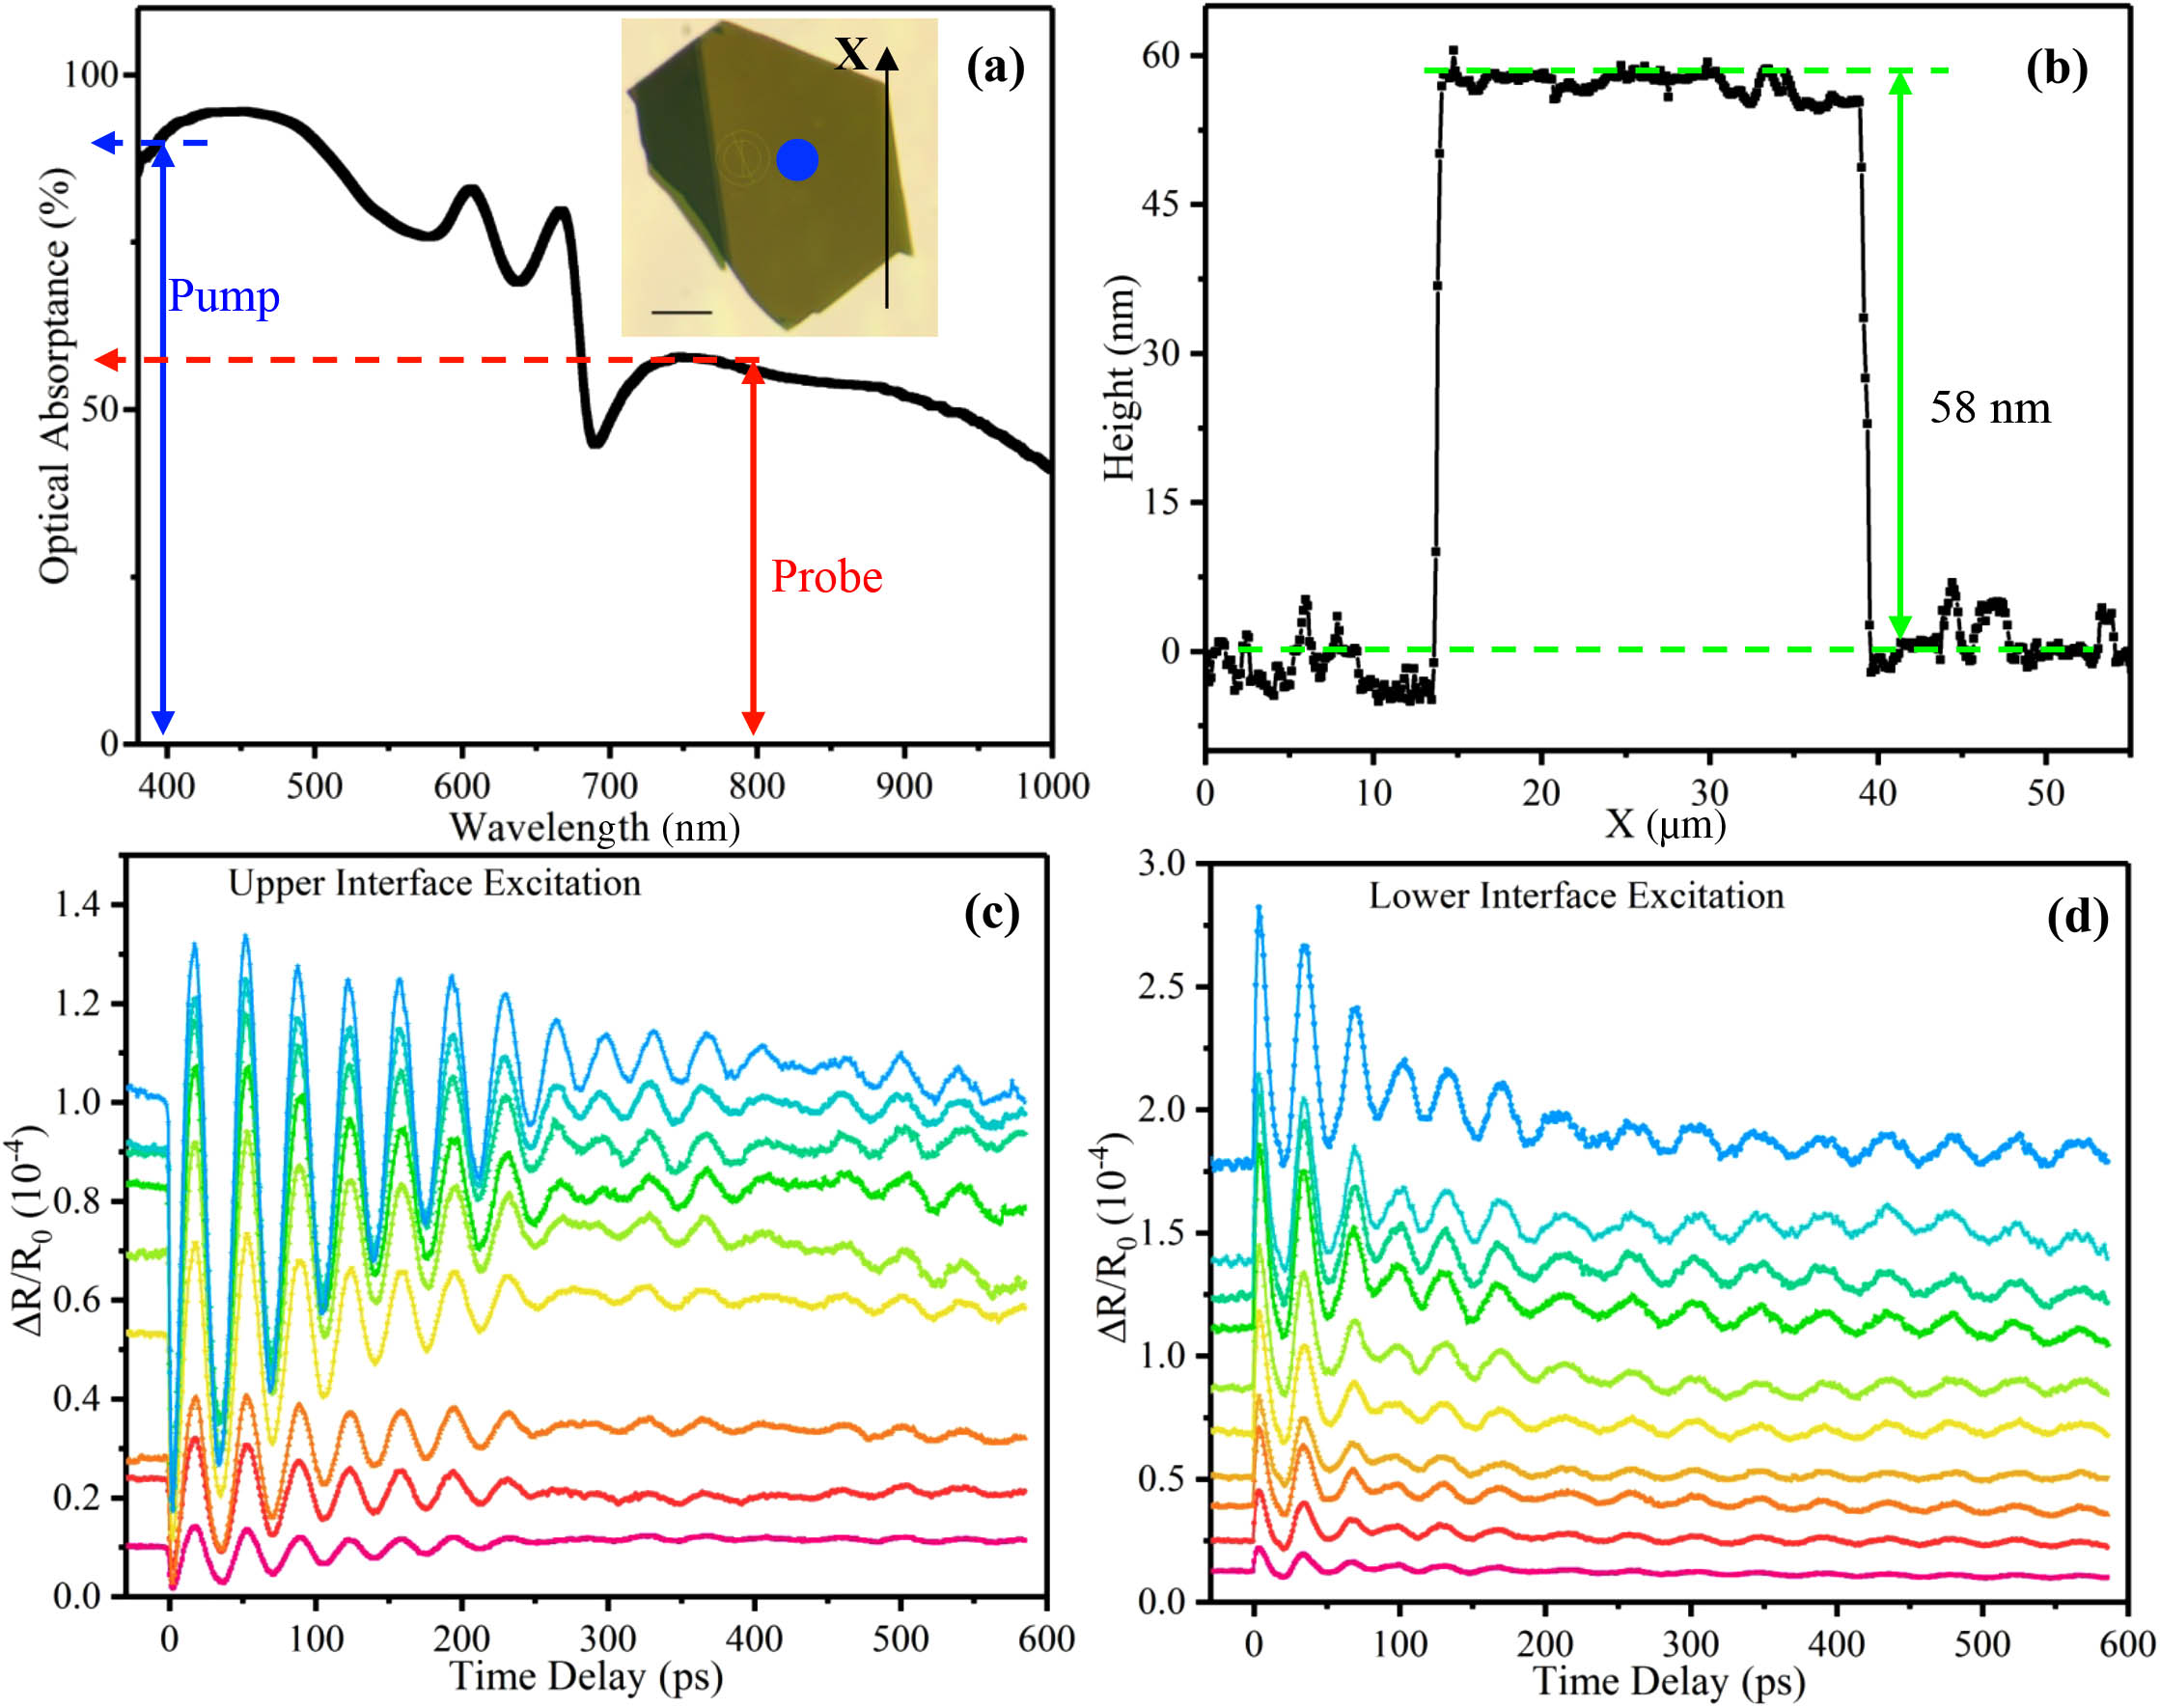
    Fig. 2. Sample information and time-resolved probe differential reflection signals. (a) Optical absorptance of multilayer MoS2 on K9 glass substrate. Inset is the optical microscopic image with a scale bar of 10 μm. (b) AFM profile of the MoS2 sample along the black arrow in (a). (c), (d) Measured differential reflections of probe as a function of time delay under various pump fluences through upper and lower interface excitations, respectively. Pump fluences of colored curves were increased from 55.16  μJ/cm2 (bottom) to 551.6  μJ/cm2 (top) with a step size of 55.16  μJ/cm2.
    Temporal fitting and frequency domain analysis. (a) Comparison of time-resolved signals through upper and lower interface excitations when the pump fluence was fixed at 551.6 μJ/cm2. Solid purple lines are bi-exponential fittings. (b) Extracted damped oscillation signals from (a). (c), (d) FFT of (b). FFT magnitude as a function of frequency. Solid lines are Lorentzian fittings. (e), (f) Fitted temporal traces of CAP oscillation of MoS2 (green curves) and emitted PA pulse in glass (black curves) for (c) and (d), respectively.
    Fig. 3. Temporal fitting and frequency domain analysis. (a) Comparison of time-resolved signals through upper and lower interface excitations when the pump fluence was fixed at 551.6  μJ/cm2. Solid purple lines are bi-exponential fittings. (b) Extracted damped oscillation signals from (a). (c), (d) FFT of (b). FFT magnitude as a function of frequency. Solid lines are Lorentzian fittings. (e), (f) Fitted temporal traces of CAP oscillation of MoS2 (green curves) and emitted PA pulse in glass (black curves) for (c) and (d), respectively.
    Dynamical evolutions of the interfacial energy couplings and the emitted PA pulse lifetimes. (a) Observed resonant peaks as a function of pump fluence for the upper and lower interface excitations. (b) FFT magnitude ratio between the K9 glass peak and the MoS2 peak for upper and lower interface excitations. (c) Fitted MoS2 CAP oscillation lifetimes as a function of pump fluence for the upper and lower interface excitations. (d) Emitted PA pulse width ratio between the lower and upper interface excitations as a function of pump fluence.
    Fig. 4. Dynamical evolutions of the interfacial energy couplings and the emitted PA pulse lifetimes. (a) Observed resonant peaks as a function of pump fluence for the upper and lower interface excitations. (b) FFT magnitude ratio between the K9 glass peak and the MoS2 peak for upper and lower interface excitations. (c) Fitted MoS2 CAP oscillation lifetimes as a function of pump fluence for the upper and lower interface excitations. (d) Emitted PA pulse width ratio between the lower and upper interface excitations as a function of pump fluence.
    (a) PA pulse compression mechanism. (b) Equilibrium-temperature evolution as a function of the pump fluence. Solid lines are linear fittings. (c) PA pulse broadening mechanism. (d) Signature of anharmonic CAP oscillations of the MoS2 lattice. Anharmonic frequency components (gray shadow regions) emerge when pump fluences exceed the threshold (magnenta curves, 276 μJ/cm2). Pump fluences of black and orange curves are below and above the threshold, respectively.
    Fig. 5. (a) PA pulse compression mechanism. (b) Equilibrium-temperature evolution as a function of the pump fluence. Solid lines are linear fittings. (c) PA pulse broadening mechanism. (d) Signature of anharmonic CAP oscillations of the MoS2 lattice. Anharmonic frequency components (gray shadow regions) emerge when pump fluences exceed the threshold (magnenta curves, 276  μJ/cm2). Pump fluences of black and orange curves are below and above the threshold, respectively.
    Wenxiong Xu, Yuanyuan Li, Qiannan Cui, He Zhang, Chuansheng Xia, Hao Guo, Guangquan Zhou, Jianhua Chang, Hui Zhao, Jun Wang, Zhongze Gu, Chunxiang Xu. All-optical generation, detection, and manipulation of picosecond acoustic pulses in 2D semiconductor/dielectric heterostructures[J]. Photonics Research, 2023, 11(12): 2000
    Download Citation