1State Key Laboratory of Bioelectronics, School of Biological Science and Medical Engineering, Southeast University, Nanjing 210096, China
2School of Electronic and Information Engineering, Nanjing University of Information Science and Technology, Nanjing 210044, China
3Department of Physics and Astronomy, The University of Kansas, Lawrence, Kansas 66045, USA
4Laboratory of Micro-Nano Optoelectronic Materials and Devices, Key Laboratory of Materials for High-Power Laser, Shanghai Institute of Optics and Fine Mechanics, Chinese Academy of Sciences, Shanghai 201800, China
Launching, tracking, and controlling picosecond acoustic (PA) pulses are fundamentally important for the construction of ultrafast hypersonic wave sources, ultrafast manipulation of matter, and spatiotemporal imaging of interfaces. Here, we show that GHz PA pulses can be all-optically generated, detected, and manipulated in a 2D layered heterostructure using femtosecond laser pump–probe. Based on an interferometric model, PA pulse signals in glass are successfully decoupled from the coexisting temperature and photocarrier relaxation and coherent acoustic phonon (CAP) oscillation signals of lattice in both time and frequency domains. Under selective interface excitations, temperature-mediated interfacial phonon scatterings can compress PA pulse widths by about 50%. By increasing the pump fluences, anharmonic CAP oscillations of lattice are initiated. As a result, the increased interatomic distance at the interface that reduces interfacial energy couplings can markedly broaden the PA pulse widths by about 150%. Our results open new avenues to obtain controllable PA pulses in 2D semiconductor/dielectric heterostructures with femtosecond laser pump–probe, which will enable many investigations and applications.
1. INTRODUCTION
Picosecond acoustic (PA) pulses with GHz frequencies, emitted during the interaction between an intense laser pulse and thin solid films, are hypersonic wave pulses propagating at acoustic velocity. In history, the experimental generation and detection of PA pulses can be traced back to 1980s facilitated by the rapid advances of ultrafast lasers, when thin semiconductor and metal films served as photoacoustic transducers [1–3]. Compared to conventional MHz ultrasonic waves emitted from AC–electric-field driven transducers, PA pulses possess two unique physical features: (i) ultrahigh frequency approaching the Debye limit; (ii) ultrashort pulse width on the order of picosecond. By inducing transient strain and stress during propagation, PA pulses can be used to control the ultrafast response of matters and devices. For instance, PA pulses have been applied to induce a transient phase change of quantum materials [4,5] and to serve as an ultrafast switch to actively control lasing actions [6,7]. More importantly, PA pulses behaving as mechanical waves can propagate in almost all condensed matters [8]. For optical scattering media like soft matters or nontransparent media like metals, in which the penetration depth of ultrafast laser pulses becomes rather small, PA pulses provide a complementary means to extract information of fine internal structures including buried interfaces with high spatiotemporal resolutions [9,10]. Through a fusion between PA pulses and femtosecond laser pump–probe, standard instruments for the semiconductor industry have been built to realize fast and noninvasive parameter measurements of integrated circuits [11], such as the accurate thickness of thin films, and the mechanical properties and quality of interfacial bondings [12–17]. For fundamental scientific research, applications of PA pulses nowadays present an interdisciplinary trend. Increasing attention has been devoted to extending the frontiers of PA pulses in physical, material, chemical, and biomedical engineering sciences [18–24].
Launching a controllable PA pulse highly depends on the light-absorbing thin-film photoacoustic transducer. Fabrications of conventional photoacoustic transducers, including metal thin films, bulk semiconductor thin films, and quantum wells, usually involve complicated and high-cost procedures, which have limited their versatile applications. In recent years, 2D layered semiconductors, such as transition metal dichalcogenides (TMDs), have presented superior physical, mechanical, and chemical properties through extensive investigations [25–28]. The advantages of sub-nanometer thickness, low-cost, facile fabrication, and integration make them a promising candidate for next-generation semiconductor. Van der Waals interlayer bondings of 2D semiconductors significantly simplify the construction of various heterointerfaces by transferring them onto the surface of many solid, liquid, and soft matters [29,30], which provides new options to develop a new type of widely applicable photoacoustic transducer emitting PA pulses. Previously, with low wavenumber Raman spectroscopy and femtosecond laser pump–probe, it has been demonstrated that coherent acoustic phonon (CAP) oscillations of 2D layered semiconductor lattices can be generated when interacting with laser pulses and the frequencies of such CAP oscillations undertake quantum dependence on layer numbers [31,32]. By monitoring the CAP oscillations of 2D layered semiconductors, out-of-plane tensor moduli and the interfacial coupling quality also have been investigated [33]. However, how to utilize the CAP oscillations of 2D layered semiconductor lattices to emit a controllable PA pulse has been rarely discussed. A controllable PA pulse source is expected to possess tunable wave properties, such as pulse width. Unfortunately, as bosons, CAP cannot directly interact with electromagnetic fields, making it difficult to actively manipulate PA pulse. Meanwhile, coupled multiphysical processes at the interfaces of 2D layered semiconductors are very complicated when interacting with intense femtosecond laser pulses. Hence, seeking ways and elucidating mechanisms to actively control PA pulses with 2D layered semiconductors are imperative.
In this work, we comprehensively demonstrate all-optical generation, detection, and manipulation of GHz PA pulses by femtosecond laser pump–probe in a 2D semiconductor/3D dielectric heterostructure, which consists of a 58 nm thick and K9 glass. With an interferometric model based on a causality scheme, the spatiotemporal principles of PA pulse generation and detection have been theoretically established. Subsequently, we show that time-resolved signals containing multiphysical information of the emitted PA pulse in glass, the photocarrier/thermal dynamics, and CAP oscillations of lattices can be successfully decoupled in both time and frequency domains. Through selective interface excitation and only tuning pump fluences, we further show that the pulse width of emitted PA pulses in glass can be actively manipulated. By spatiotemporal correlation analysis of multiphysical processes, PA pulse compression and broadening mechanisms have been elucidated. The proposed theoretical model, experimental method, and signals analysis procedure are expected to be widely applicable for heterointerfaces consisting of 2D layered semiconductors. Our results not only validate that 2D layered semiconductors can serve as extraordinary photoacoustic transducers emitting PA pulses into 3D dielectric structures, but also provide new physical mechanisms and practical approaches to all-optically control PA pulses, which is of great significance for fundamental research and a broad spectrum of applications.
Sign up for Photonics Research TOC. Get the latest issue of Photonics Research delivered right to you!Sign up now
2. PHYSICAL SCHEME OF PA PULSE EMISSION, DETECTION, AND MANIPULATION
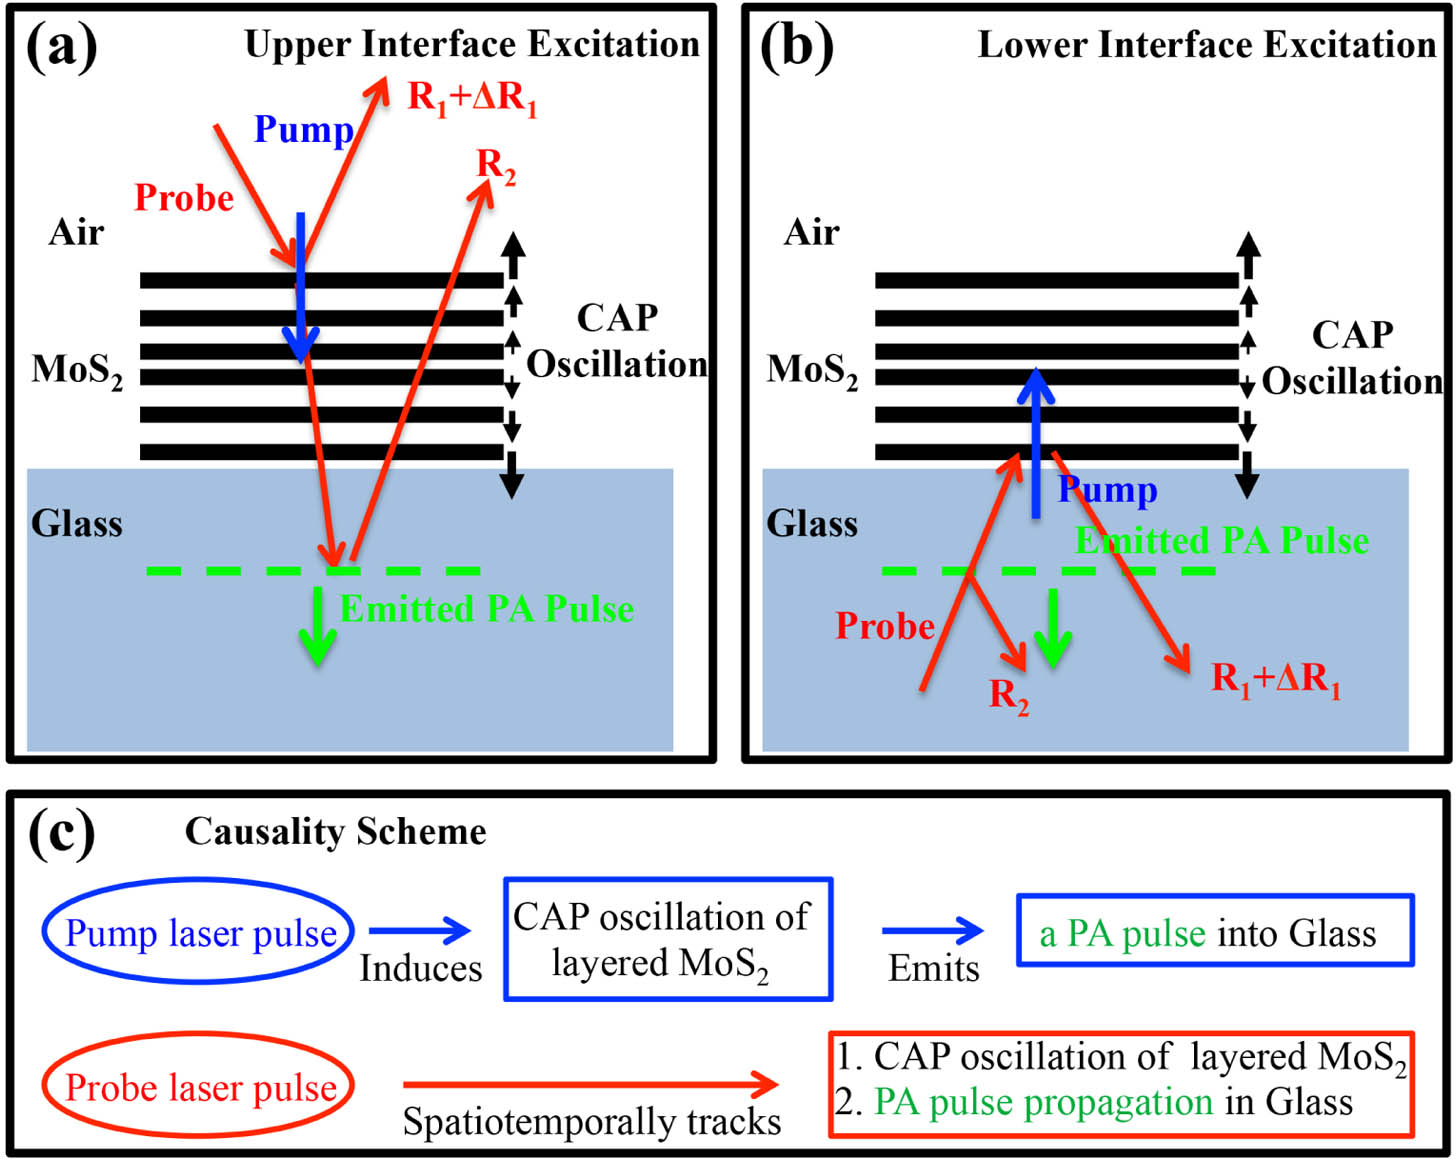
To demonstrate the principle of PA pulse generation, detection, and manipulation with 2D layered semiconductors such as , we propose a physical scheme that is illustrated in Fig. 1. Through femtosecond pump excitation, out-of-plane CAP oscillations of the lattice can be initiated through deformation potential stress. If a thin film is suspended in air, there will be no PA pulse emitted. Being different in a heterostructure, a periodic force will be applied on glass at the heterointerface by CAP oscillation of the layers. Displacements of the layers form interlayer breathing modes of CAP oscillations, as depicted by the black arrows in Figs. 1(a) and 1(b). Serving as a longitudinal wave source, the CAP oscillation of the lattice is expected to emit a PA pulse (a transient strain pulse) into the glass, as illustrated by the green arrows. Due to causality, emitted PA pulse propagating in glass at acoustic velocity is expected to possess a pulse width equal to CAP oscillation lifetime of the lattice. Since light speed is about five orders of magnitude higher than the acoustic velocity, another femtosecond laser probe pulse (red arrows, co-propagating with the pump) can be used to track the spatiotemporal propagation of emitted PA pulse. Despite the probe laser reflection at interface, the probe laser can also be reflected by the propagating PA pulse because the wave packet of the emitted PA pulse can trigger a refractive index change in K9 glass, which forms a light reflection interface indicated by the dashed green lines. Recorded differential reflection signals by detector will be the superposition of reflected probe pulses by the () interface as well as the wave packet position of PA pulse. Under such an interferometric detection scheme, time-resolved signals of probe differential reflection are expected to contain information of spatiotemporal propagation of emitted PA pulse in glass, photocarrier dynamics, thermal evolution, and CAP oscillation of lattices.
Figure 1.Physical scheme. All optical generation and detection of picosecond acoustic pulses via (a) upper interface excitation and (b) lower interface excitation. (c) Causality scheme and physical observable detected.
To qualitatively and unambiguously address experimental realization of the proposed physical schemes employing femtosecond laser pump–probe, a phenomenological model elucidating the relation between the observables and the physical realities has been established. Under the interferometric detection scheme, one can model detected signals as the spatiotemporal superposition of the electric fields of reflected probe laser pulses. As depicted in Fig. 1(a), intensities of reflected probe by the interface and by propagating PA pulse in K9 glass are denoted by and , respectively. Note that was defined at the interface to simplify the calculation. Relying on ultrafast multiphysical dynamics of the heterostructure, differential reflection signals of the probe will be spatiotemporally dependent. Specifically, if no PA pulse is emitted into the glass after the pump pulse excitation, detected probe intensity can be related to the reflected electric fields by where and are electric fields of reflected probe pulse by the interface before and after the pump pulse excitation, respectively. Then, detected differential reflection of the probe can be calculated as where the approximation is based on the fact that . Immediately followed by optical excitation of the pump pulse, photocarrier energy relaxation, temperature increase, and CAP oscillation of the lattice will all contribute to the term . Here, three functions of are defined to specify different physical origins. In addition, the signs of these three contributions should be emphasized: can be either positive or negative depending on band structure of the ; is positive because refractive index of the tends to increase when increasing the temperature of the lattice according to previous reports [34]; and is oscillating between positive and negative since CAP oscillations will induce compression and expansion strains for the lattice.
Furthermore, if a PA pulse is emitted into the glass after the pump pulse excitation, a local refractive index changing interface accompanying the PA pulse propagation can also reflect the probe. By defining reflected electric field of probe caused by PA pulse as , detected probe intensity can be written as
Subsequently, detected differential reflection of the probe becomes where the approximation is further made based on the fact that , and is the contribution of the propagating PA pulse in glass, the sign of which oscillates between positive and negative. In previous picosecond acoustic studies of metal and conventional semiconductors, the last term was named as Brillouin oscillation of PA pulse [35]. For the lower interface excitation shown in Fig. 2(b), derivations and interpretations of physical realities are identical.
Figure 2.Sample information and time-resolved probe differential reflection signals. (a) Optical absorptance of multilayer on K9 glass substrate. Inset is the optical microscopic image with a scale bar of 10 μm. (b) AFM profile of the sample along the black arrow in (a). (c), (d) Measured differential reflections of probe as a function of time delay under various pump fluences through upper and lower interface excitations, respectively. Pump fluences of colored curves were increased from μ (bottom) to μ (top) with a step size of μ.
In brief, emitted PA pulse in glass is induced by CAP oscillation of the lattice, and corresponding energy conversion occurs at the heterointerface, as summarized in Fig. 1(c). Therefore, to manipulate the properties of emitted PA pulse, one can either mediate CAP oscillations of the lattice or tailor interfacial couplings. Here, we aim to actively manipulate the PA pulse width without altering the layer number of and the substrate material by only considering how to control the pump laser pulses. Intuitively, we attempt to control penetration depth, excitation position, and fluence of the pump laser pulses. First of all, the pump laser penetration depth can be controlled by tuning the pump laser wavelength with respect to the thickness of multilayer sample with indirect band gap. Indicated by the blue arrows in Figs. 1(a) and 1(b), we intend to set the pump penetration depth to be about half of thickness. Secondly, selective excitation position can be realized by changing incident direction of femtosecond pump pulse. Normal incidence of focused pump laser with opposite wave vectors can selectively excite the interface and the interface, schemes of which are named as the upper interface excitation and the lower interface excitation, respectively. Thirdly, pump fluences can be adjusted by tuning the optical elements in our experimental setup.
3. RESULTS AND DISCUSSION
A. Femtosecond Laser Pump–Probe Experiments
Based on the aforementioned physical schemes, we performed experimental investigations by femtosecond laser pump–probe in ambient conditions. The heterostructure was constructed by transferring a sample of about 58 nm thick obtained by mechanical exfoliation on K9 glass substrate. The lattice consists of about 88 layers considering thickness of monolayer is about 0.66 nm [36]. Optical absorptance of the sample is presented in Fig. 2(a) and the inset is an optical microscopic image obtained in light transmission mode. The thickness of the sample measured by atomic force microscopy (AFM) is presented in Fig. 2(b). The optical absorptance in the visible region is obviously larger than that in near-infrared region, agreeing well with indirect band structure of multilayer . Due to out-of-plane quantum confinements, two excitonic resonant peaks centered at about 620 nm and 660 nm can be clearly identified. The acoustic impedance of K9 glass substrate is comparable to bulk , forming an acoustic impedance-matching interface with the bulk . Meanwhile, both acoustic velocity and optical refractive index of K9 glass have been well known. A home-built femtosecond laser pump–probe system is employed to conduct time-resolved measurements. Colinearly propagating pump and probe are tightly focused on the heterostructure by an objective lens (). Reflected probe is recollected by the same objective lens and sent to a photodetector. The wavelengths of pump and probe are fixed at 400 nm and 800 nm, respectively. At the wavelength of pump laser (400 nm), pump penetration depth in the sample is calculated to be about 25.2 nm with measured optical absorptance of 90%, as indicated by the blue arrows in Fig. 2(a). The pump penetration depth is 43.4% of the sample thickness; therefore, it can be expected that after 400 nm pump pulse excitation, axial distributions of initial photocarrier and photo-induced-heat will be highly inhomogeneous. At the wavelength of probe laser (800 nm), as shown by the red arrows in Fig. 2(a), measured optical absorptance is about 60%. This result means that after penetrating the lattice, 40% of probe power can be still left and used to spatiotemporally track the propagation of emitted PA pulse in glass, which is necessary for the upper interface excitation scheme proposed in Fig. 1(a). The thickness of K9 glass is about 460 μm. The pump fluence reflection loss (about 4%) across the air/glass interface for lower interface excitation is neglected.
By adjusting the pump fluences, measured probe differential reflection signals under upper and lower interface excitation schemes as a function of time delay, are plotted in Figs. 2(c) and 2(d), respectively. All differential reflection signals present positive backgrounds before zero delay (0 ps) and complicated oscillation traces after zero delay, magnitudes of which tend to increase for increased pump fluences. The nonzero background signals before zero delay suggest that some kind of pump-induced energies cannot be fully dissipated within the time interval of incoming pump pulses (about 12.5 ns). In previous studies, experiments have shown that the photocarrier lifetimes of multilayer and bulk TMDs are approximately hundreds of picoseconds [37]. For sample with indirect band gap, despite generating photocarrier and CAP, partial energy of absorbed pump laser pulse will be converted into heat. Temporally, local temperature evolution of the lattice is expected to undergo a transient increase following instantaneous optical absorption of pump pulse and then relatively slow temperature decays driven by thermal dissipations of the heterostructure, which usually involve heat diffusion and interfacial heat transfer. Due to the limited heat diffusion coefficient of and interfacial thermal resistance, lifetime of the temperature decays in our heterostructure is expected to be much longer than that of photocarrier and CAP. Therefore, the nonzero background signals before zero delay can be reasonably attributed to equilibrium temperature rise of the lattice, originating from pump-induced heats. At room temperature, undertakes a positive thermo-optic coefficient of around the probe wavelength of 800 nm [34], where and stand for the refractive index and the temperature, respectively. Based on Snell’s law for normal incidence, increased temperature of the lattice in our experimental configurations is expected to increase the probe reflection coefficients at and interfaces, which satisfactorily agree with the observed positive sign of probe differential reflection signals before zero delay in Figs. 2(c) and 2(d). At this point, one can further conclude that the sign of the transient temperature decay component after zero delay must also be positive, although mixing with photocarrier and CAP signals.
B. Analysis of CAP and PA Pulse Modes
Next, we focused on the analysis of measured probe differential reflection signals after zero delay. Two representative time-resolved signals involving upper and lower interface excitations are presented in Fig. 3(a), where both pump fluences are equally fixed at μ. According to the discussion of Eq. (4), the transient photocarrier and temperature decay components are expected to be exponentially decaying, while the CAP oscillation of the lattice and emitted PA pulse in glass should be damped oscillations. To extract the CAP components, we can fit time-resolved signals after zero delay with a bi-exponential decay function by setting nonzero signals before zero delay as an offset. Interestingly, fitted curves of solid purple lines are negative and positive for upper and lower interface excitations, respectively. Since the sign of transient temperature decay component after zero delay has been determined to be positive, the sign of photocarrier energy relaxations must be negative. Based on the fact that the same positions of the sample are measured, if we assume that both absorbed pump photon numbers and magnitude of the photocarrier decay component are equal for upper and lower interface excitations, the magnitude of the temperature decay component for the lower interface excitation turns out to be larger than that for the upper interface excitation. This means that more heat can be generated for the lower interface excitation. It can be further validated by noticing that the magnitude of the nonzero signal before zero delay for lower interface excitation is also larger than that for upper interface excitation. As the optical penetration depth of pump pulse is 43.4% of thickness, heat generations and dissipations in the lattice have been markedly mediated by the interface.
Figure 3.Temporal fitting and frequency domain analysis. (a) Comparison of time-resolved signals through upper and lower interface excitations when the pump fluence was fixed at μ. Solid purple lines are bi-exponential fittings. (b) Extracted damped oscillation signals from (a). (c), (d) FFT of (b). FFT magnitude as a function of frequency. Solid lines are Lorentzian fittings. (e), (f) Fitted temporal traces of CAP oscillation of (green curves) and emitted PA pulse in glass (black curves) for (c) and (d), respectively.
Then, the differences between the full measured data and fitted bi-exponential decay curve from Fig. 3(a) are plotted in Fig. 3(b), which contain information of CAP oscillation of the lattice and emitted PA pulse in glass. To temporally decouple these two different time-resolved CAP components, the resonant frequencies of them need to be quantified. Fast Fourier transformations (FFTs) for the fitting residuals of the upper (red dots) and lower (blue dots) interface excitations are performed. We point out that zero padding of data in Fig. 3(b) is deployed to increase the peak-fitting accuracy of FFT spectra, as shown in Figs. 3(c) and 3(d). Clearly, two predominant resonant peaks are obtained. The solid black and green lines indicate fitted curves of frequency spectra employing Lorentzian functions. For the upper interface excitation in Fig. 3(c), the central peaks of the solid black and green lines are at about 22.6 GHz and 28.5 GHz, respectively. For lower interface excitation in Fig. 3(d), the central peaks of the solid black and green lines are at about 22.6 GHz and 30.2 GHz, respectively. We tentatively attribute the 22.6 GHz frequency component to the emitted PA pulse in K9 glass, by noticing that both FWHM and central peak position of this component are independent of interface excitation schemes. To quantitatively identify the physical nature of 22.6 GHz peak, we calculate the acoustic velocity of K9 glass by using the well-established Brillouin oscillation model of the PA pulse [35,38] as where is the observed Brillouin oscillation frequency, is the refractive index of K9 glass at the probe wavelength (), and is acoustic velocity of K9 glass. With from the Schott glass database, we find that the measured acoustic velocity of K9 glass from our time-resolved experiments is , agreeing well with previous result () [39].
After determining the emitted PA pulse frequency component, according to the causality scheme, the other frequency component at 28.5 (30.2) GHz can be attributed to CAP oscillations of the lattice. Based on out-of-plane interlayer breathing mode of 2D layers, the resonant frequency of CAP oscillations in lattice can be expressed by where (30.2) GHz is resonant frequency of CAP oscillation of the lattice, and is the thickness of the sample. Hence, calculated acoustic velocity of the lattice is (3503.2 m/s) for the upper (lower) interface excitation. Our results of the acoustic velocity are close to previous reports [40,41]. Then, the out-of-plane Young’s modulus can be calculated by where is out-of-plane elastic modulus tensor element, and stands for density of . With , the out-of-plane Young’s modulus is calculated to be (62.1 GPa), agreeing well with Refs. [40,41]. It should be noticed that the acoustic velocity and the out-of-plane Young’s modulus of obtained under lower interface excitation measurements are slightly larger than the results measured through upper interface excitation. We attribute the blueshifted CAP frequency to the interfacial coupling effects between the lattice and K9 glass, which is consistent with previous experimental and theoretical results based on a 1D linear chain model with a fixed rigid wall [42,43].
With the obtained resonant frequency peaks of two CAP components, and , we can move on to fit the time-resolved CAP signals in Fig. 3(b) with the damped oscillation function , where is the amplitude, is the lifetime, and is the initial phase. The angular frequency of the two CAP components can be calculated by and , both of which have been fixed in our fittings. The lifetimes of PA pulses depend on the intrinsic properties of glass, such as the acoustic attenuation coefficient, instead of the pump incident direction. Through tentative global-fitting attempts, the best curve-fittings have been achieved by fixing at 1000 ps for all time-resolved signals. Fitted curves are depicted by solid green lines, as shown in Fig. 3(b). The waveform of the fitted temporal oscillations for the upper interface excitation clearly presents a beat between 300 ps and 600 ps. For the lower interface excitation, a similar beat-waveform can be observed between 50 ps and 300 ps. Such beat features not only validate the high quality of our fittings, but also support our signal decoupling procedure as well as the proposed physical scheme in Fig. 1.
In Figs. 3(e) and 3(f), we plot the fitted CAP oscillations of the lattice (solid green lines) and emitted PA pulses in glass (solid black lines). Clearly, the lifetime of CAP oscillation of the lattice through the lower interface excitation is much shorter than that through the upper interface excitation. According to the causality scheme, the pulse width of emitted PA pulse should be equal to the CAP oscillation lifetime of its source, the lattice. Therefore, the pulse width of emitted PA pulse through lower interface excitation has been compressed compared to the scenario of upper interface excitation. As indicated by the dashed red and blue arrows, the initial amplitudes of the CAP oscillation signals (green curves) around zero delay for the upper and lower interface excitations are almost equal. That means that the initial lattice displacements at the and interfaces are comparable. The energy conversion from the CAP oscillation of the lattice to the PA pulse in glass is accomplished by the periodic acoustic stress at the interface. The glass substrate serving as a rigid wall will induce an equal but opposite stress on the lower surface layer of , due to Newton’s third law. In the physical picture of the layer breathing mode as indicated by Figs. 1(a) and 1(b), a compression (expansion) state of the upper surface layer is always associated with an expansion (compression) state of the lower surface layer. Meanwhile, the sign of terms in Eq. (4) depends on the compression or expansion state of the surface layer. As a result, for the upper and lower interface excitation schemes, the initial signs of the CAP oscillation signals are expected to be opposite, agreeing well with the observed anti-phase features of the green curves in Figs. 3(e) and 3(f). In addition, although the initial amplitude around zero delay for the lower interface excitation is also comparable to that for the upper interface excitation, fitted phase difference of emitted PA pulses in glass is about , as shown by the black curves in Figs. 3(e) and 3(f). The reason is that the round trip of the probe pulse within the lattice for the upper interface excitation will induce a phase difference compared to the case of the lower interface excitation, as shown in Figs. 1(a) and 1(b). Under normal incidence of probe, it is straightforward to estimate the phase difference by , where is the refractive index of for [44].
C. Physical Mechanism of PA Pulse Dynamical Evolution
By decoupling all frequency-resolved and time-resolved spectra measured by tuning the pump fluence, we are able to evaluate the dynamical evolution of the PA pulse generation and propagation. As shown in upper panel of Fig. 4(a), when increasing pump fluences under upper interface excitation, FFT magnitudes of CAP oscillations in lattices at 28.5 GHz (green squares) present a super-linear increasing trend, while FFT magnitudes of PA pulses in K9 glass at 22.6 GHz (black squares) present a sublinear increasing trend. Through empirical linear fittings in dashed lines, one can identify that once pump fluence exceeds a threshold of about μ, both energies of CAP oscillation and PA pulse experience a nonlinear change. As illustrated by the two magenta arrows, an additional energy increase for the CAP oscillation after the pump fluence threshold is always accompanied by an energy decrease for the PA pulse. Since the CAP oscillation of lattice is the source of emitted PA pulse in K9 glass, it is reasonable to expect that interfacial PA pulse energy conversion efficiency is dramatically decreased. The two frequency components in the lower panel of Fig. 4(a) undertake similar evolving trends but comparable FFT magnitudes. Thus, empirical linear fittings have not been performed. To reveal a dynamical change of CAP couplings at the interface, we can calculate the PA pulse energy conversion efficiency by dividing the FFT magnitude of PA pulse by the FFT magnitude of CAP oscillation. Interestingly, the red squares in Fig. 4(b) show that the PA pulse energy conversion efficiencies under upper interface excitation present a plateau-decreasing trend with a pump fluence threshold equal to that observed in Fig. 4(a). Solid black and magenta lines are linear fittings. For lower interface excitation, similar calculations are performed and a plateau-decreasing trend of PA pulse energy conversion efficiency [blue dots in Fig. 4(b)] is also observed. Comparing with upper interface excitation, observed dynamical evolution trend and pump fluence threshold for lower interface excitation are both identical, but PA pulse energy conversion efficiencies tend to be higher.
Figure 4.Dynamical evolutions of the interfacial energy couplings and the emitted PA pulse lifetimes. (a) Observed resonant peaks as a function of pump fluence for the upper and lower interface excitations. (b) FFT magnitude ratio between the K9 glass peak and the peak for upper and lower interface excitations. (c) Fitted CAP oscillation lifetimes as a function of pump fluence for the upper and lower interface excitations. (d) Emitted PA pulse width ratio between the lower and upper interface excitations as a function of pump fluence.
The dynamical evolution of pulse width of emitted PA pulses in glass can be revealed by fitted CAP oscillation lifetimes of lattice as plotted in Fig. 4(c), based on the aforementioned causality scheme of PA pulse generation. From these results, two striking features can be summarized. (i) The pulse widths of emitted PA pulses in glass under upper (red squares) and lower (blue dots) interface excitations both present plateau-increasing trends as a function of pump fluence. Observed pump fluence thresholds correlate well with that of PA pulse energy conversion efficiencies in Fig. 4(b), suggesting the interfacial CAP energy couplings as well as PA pulse generations can transit from linear to nonlinear regimes by increasing pump fluences. Overall, the pulse widths of emitted PA pulses in this heterostructure can be actively manipulated between 50 ps and 150 ps. (ii) The calculated PA pulse width ratios between the lower and upper interface excitations are about 0.5, as shown in Fig. 4(d), which are independent of pump fluence. It suggests the pulse width of emitted PA pulse can be effectively compressed simply by selective interfacial excitation of femtosecond pump pulses.
Finally, we elucidate physical mechanisms of observed PA pulse dynamical evolutions by spatiotemporally correlating multiphysical processes in the heterostructure, especially at the interface. First of all, to address the mechanism of PA pulse width compression under lower interface excitation, spatial distribution of transient temperature fields induced by the pump pulse must be investigated. Due to the limited optical penetration depth of pump pulse (about half of the thickness), the transient temperature field distribution is expected to be highly inhomogeneous along direction in the lattice. For lower interface excitation, the temperature field gradient in the lattice is depicted by the red shadow region in Fig. 5(a). For upper interface excitation, the pump pulse induced transient temperature fields are spatially located at the interface so the CAP energy couplings at the interface will be less likely to be affected. Following the pump pulse excitation, the increased temperature of the layers attached on the glass substrate is expected to enhance the interfacial CAP scattering, which is expected to mediate the CAP oscillations of the lattice as well as the interfacial PA pulse energy conversion processes. In our opinion, the increased temperature of these specific layers will lead to heat-induced interfacial disorders, which will significantly enhance the diffusive mismatch CAP scatterings at the interface [45]. As a result, additional energy dissipation channel of CAP oscillations of the lattice is created. In this way, the lifetime of CAP oscillation of the lattice is reduced and the corresponding pulse width of emitted PA pulse in glass is compressed. Acoustic mismatch CAP scattering is less likely because the acoustic impedances of and K9 glass are comparable. Dissipated energy of CAP oscillations of lattice during the process of interfacial diffusive mismatch phonon scattering will eventually be converted into heat. Additional heat generation is then expected to further increase equilibrium temperature of lattice, which is manifested by larger probe differential reflection signals before zero delay in Fig. 2(d) compared to that in Fig. 2(c). By scaling the lattice temperature before 0 ps (arbitrary unit) with measured probe differential reflection signals before zero delay, we plot the equilibrium temperature evolutions of the surface layers attached on the (red squares) and (blue dots) interfaces as a function of the pump fluence in Fig. 5(b). The equilibrium temperatures at the interface monotonically increase. In comparison, the equilibrium temperatures at the /glass interface show a turning point with a pump fluence threshold, which is equal to that observed in Figs. 4(b) and 4(c).
Figure 5.(a) PA pulse compression mechanism. (b) Equilibrium-temperature evolution as a function of the pump fluence. Solid lines are linear fittings. (c) PA pulse broadening mechanism. (d) Signature of anharmonic CAP oscillations of the lattice. Anharmonic frequency components (gray shadow regions) emerge when pump fluences exceed the threshold (magnenta curves, μ). Pump fluences of black and orange curves are below and above the threshold, respectively.
Such correlations indicate that interfacial thermal transfer and CAP energy coupling efficiencies at the interface are synchronously reduced when the pump fluence exceeds a certain threshold. If we only consider the fundamental interlayer breathing mode of the lattice, as shown in Fig. 5(a), collective lattice displacements of CAP oscillations are expected to be symmetrically distributed. The maximal displacements of layers are located at the and interfaces. Although interatomic distances between and glass are oscillating, the equilibrium position of the layer attaching on glass will remain still because the center of mass of the lattice will not move as the time elapses. Therefore, to reduce interfacial thermal transfer and CAP energy coupling efficiencies for this heterostructure, the center of mass of the lattice must have been shifted away from the interface when the pump fluence exceeds the threshold. This points to anharmonic CAP oscillations of the lattice. As we proposed in Fig. 5(c), when increasing the pump fluence after the threshold, the amplitudes of the lattice displacement will get large and anharmonic CAP oscillations of occur [46,47]. As a result, frequency components higher than the fundamental interlayer breathing mode will be generated, which leads to a shifted center of mass for the lattice. At the interface, time-averaged interatomic distance will correspondingly be increased, resulting in attenuated interfacial energy coupling. To validate our physical interpretation, for upper and lower interface excitations, in Fig. 5(d) we plot several representative frequency spectra of the time-resolved CAP signals when the pump fluence is below (black curves), equal to (magenta curves), and above (orange curves) the threshold. Revealed by the highlighted frequency region in the gray shadows, one can identify that higher frequency components emerge after pump fluences exceed the threshold. To make it clear, we use dashed arrows to mark the frequency positions of second and third harmonics of fundamental interlayer breathing mode of CAP oscillations. Finally, attenuated interfacial energy couplings at the interface will not only reduce the interfacial heat transfer efficiency but also decrease the energy loss of CAP oscillations of lattice, which will elongate the lifetimes of CAP oscillations of lattice as well as the pulse widths of emitted PA pulses in glass.
4. CONCLUSION
Utilizing femtosecond laser pump–probe, we demonstrated all-optical generation, detection, and manipulation of PA pulses in a multilayer heterostructure. Based on a theoretical model, time-resolved probe differential reflection signals have been fully decoupled. Simultaneous observation of CAP oscillation in lattice and emitted PA pulses in glass allows us to monitor the energy coupling dynamics across the interface. Through selective interface excitations, we show that the pulse width of emitted PA pulses in glass can be actively compressed by 50% due to enhanced interfacial phonon scattering mediated by laser-induced inhomogeneous temperature fields. Pulse width of PA pulses in glass can also broaden monotonically with increasing pump fluences after a threshold. Anharmonic CAP oscillations of lattice tend to increase the interatomic distance between and glass, which can tailor the interfacial energy coupling efficiency. These results not only elucidate the generation and detection schemes of PA pulses, but also provide new mechanisms to actively steer the spatiotemporal characteristics of PA pulses in 2D layered semiconductor/3D dielectric heterostructures. The demonstrated multiphysical field interactions across the heterointerface render this approach a widely applicable means to extract interfacial optical, acoustic, mechanical, and thermal information from hybrid microstructures containing 2D layered semiconductors. In addition, controllable PA pulse emissions through in situ ultrafast laser pulse excitations enable 2D layered semiconductors to be stable PA pulse sources, which provide an essential prerequisite for ultrafast control of matters, spatiotemporal sensing, and imaging applications.
[21] K. Ishioka, A. Beyer, W. Stolz, K. Volz, H. Petek, U. Hfer, C. J. Stanton. Coherent optical and acoustic phonons generated at lattice-matched GaP/Si(001) heterointerfaces. J. Phys. Condens. Matter, 31, 094003(2019).
[39] Z. Hu, H. Cui, Z. An, J. Mao. Measurements of backward wave propagation using the dynamic photoelastic technique. IEEE International Ultrasonics Symposium(2016).