• Chinese Optics Letters
  • Vol. 18, Issue 4, 041701 (2020)
Xue Zhou1、3, Zhibin Jin2, Ting Feng4, Qian Cheng4, Xueding Wang4, Yao Ding1, Hongchen Zhan1、**, and Jie Yuan1、3、*
Author Affiliations
  • 1Jinling College, Nanjing University, Nanjing 210089, China
  • 2Nanjing Drum Tower Hospital, Nanjing 210008, China
  • 3School of Electronic Science and Engineering, Nanjing University, Nanjing 210093, China
  • 4Institution of Acoustics, Tongji University, Shanghai 200092, China
  • show less
    DOI: 10.3788/COL202018.041701 Cite this Article Set citation alerts
    Xue Zhou, Zhibin Jin, Ting Feng, Qian Cheng, Xueding Wang, Yao Ding, Hongchen Zhan, Jie Yuan. Bone mineral density value evaluation based on photoacoustic spectral analysis combined with deep learning method[J]. Chinese Optics Letters, 2020, 18(4): 041701 Copy Citation Text show less
    (a) Schematic diagram of the experimental setup. (b) The image of actual experimental installation.
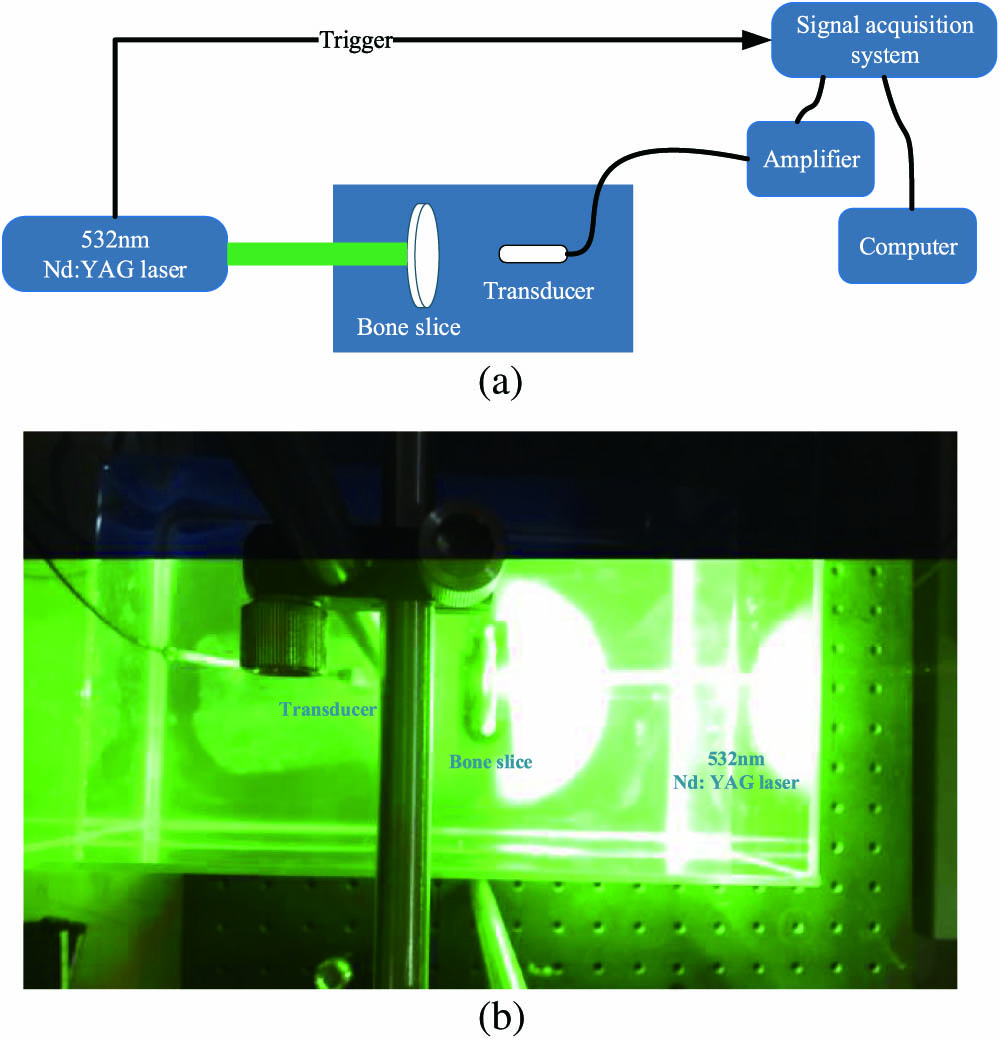
    Fig. 1. (a) Schematic diagram of the experimental setup. (b) The image of actual experimental installation.
    Step of soaking swine slices into EDTA solution to imitate the process of bone loss.
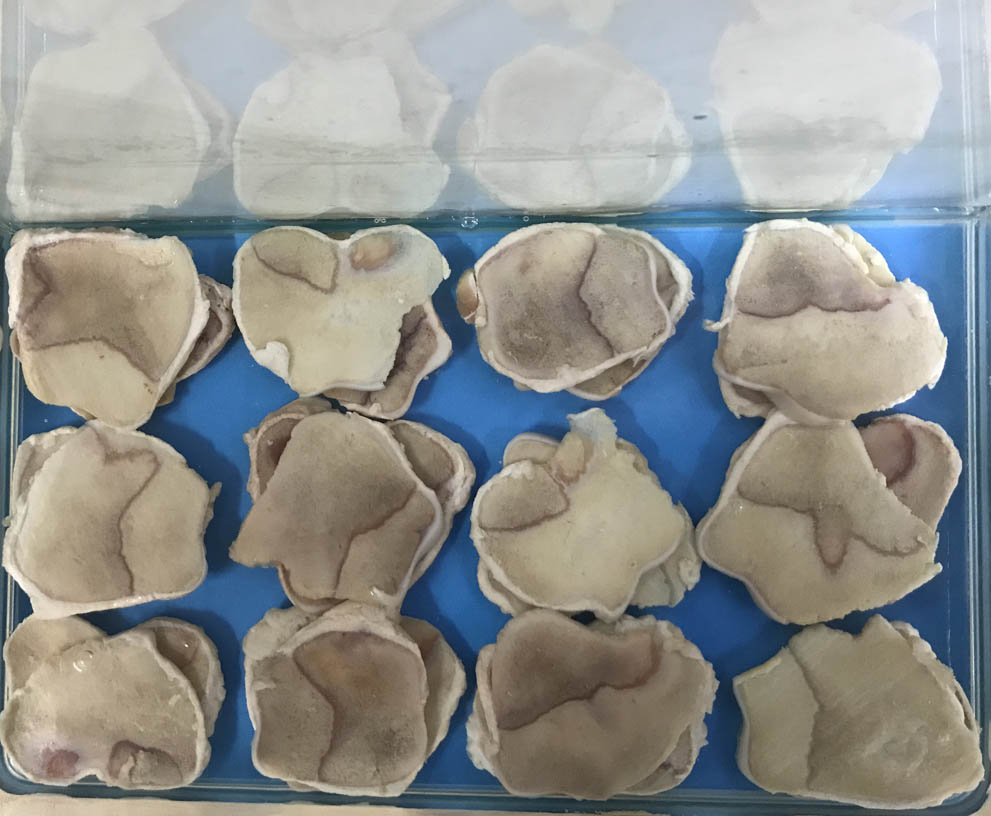
    Fig. 2. Step of soaking swine slices into EDTA solution to imitate the process of bone loss.
    Specific structure of adopted fully connected seven-layer network, and the details of layer 1 and layer 2 are presented in the right as an example.
    Fig. 3. Specific structure of adopted fully connected seven-layer network, and the details of layer 1 and layer 2 are presented in the right as an example.
    Each diagram corresponds to one stage of signal processing. (a) The raw time domain PA signal. (b) Truncated time domain PA signal. (c) Time domain PA signal of further sampling in (b); it retains the information of (b) but has a larger interval between adjacent points (scatter diagrams are utilized to discriminate them). (d) The result of (c) after Fourier transform as an example illustration of the eventual normalized input of the network.
    Fig. 4. Each diagram corresponds to one stage of signal processing. (a) The raw time domain PA signal. (b) Truncated time domain PA signal. (c) Time domain PA signal of further sampling in (b); it retains the information of (b) but has a larger interval between adjacent points (scatter diagrams are utilized to discriminate them). (d) The result of (c) after Fourier transform as an example illustration of the eventual normalized input of the network.
    Diagram of actual BMD value and its corresponding absolute error compared with the network fitting one.
    Fig. 5. Diagram of actual BMD value and its corresponding absolute error compared with the network fitting one.
    Xue Zhou, Zhibin Jin, Ting Feng, Qian Cheng, Xueding Wang, Yao Ding, Hongchen Zhan, Jie Yuan. Bone mineral density value evaluation based on photoacoustic spectral analysis combined with deep learning method[J]. Chinese Optics Letters, 2020, 18(4): 041701
    Download Citation