• Advanced Photonics Nexus
  • Vol. 1, Issue 2, 026001 (2022)
Hongsen He1、†, Huajun Tang1, Meng Zhou1, Hei Ming Lai2、3、4, Tian Qiao1、*, Yu-xuan Ren5, Cora S. W. Lai6、7, Ho Ko2、3、4, Xiaoming Wei8, Zhongmin Yang8, Kevin K. Tsia1、9, and Kenneth K. Y. Wong1、9、*
Author Affiliations
  • 1University of Hong Kong, Department of Electrical and Electronic Engineering, Hong Kong, China
  • 2Chinese University of Hong Kong, Faculty of Medicine, Department of Psychiatry, Hong Kong, China
  • 3Chinese University of Hong Kong, Faculty of Medicine, Department of Medicine and Therapeutics, Hong Kong, China
  • 4Chinese University of Hong Kong, Prince of Wales Hospital, Li Ka Shing Institute of Health Sciences, Hong Kong, China
  • 5Fudan University, Shanghai Medical College, Institute for Translational Brain Research, Shanghai, China
  • 6University of Hong Kong, School of Biomedical Sciences, Li Ka Shing Faculty of Medicine, Hong Kong, China
  • 7University of Hong Kong, State Key Laboratory of Brain and Cognitive Sciences, Hong Kong, China
  • 8South China University of Technology, School of Physics and Optoelectronics, Guangzhou, China
  • 9Advanced Biomedical Instrumentation Centre, Hong Kong, China
  • show less
    DOI: 10.1117/1.APN.1.2.026001 Cite this Article Set citation alerts
    Hongsen He, Huajun Tang, Meng Zhou, Hei Ming Lai, Tian Qiao, Yu-xuan Ren, Cora S. W. Lai, Ho Ko, Xiaoming Wei, Zhongmin Yang, Kevin K. Tsia, Kenneth K. Y. Wong. Deep-tissue two-photon microscopy with a frequency-doubled all-fiber mode-locked laser at 937 nm[J]. Advanced Photonics Nexus, 2022, 1(2): 026001 Copy Citation Text show less
    Two-photon excitation efficiency of the EGFP and EYFP under the illumination from 800 to 1000 nm.
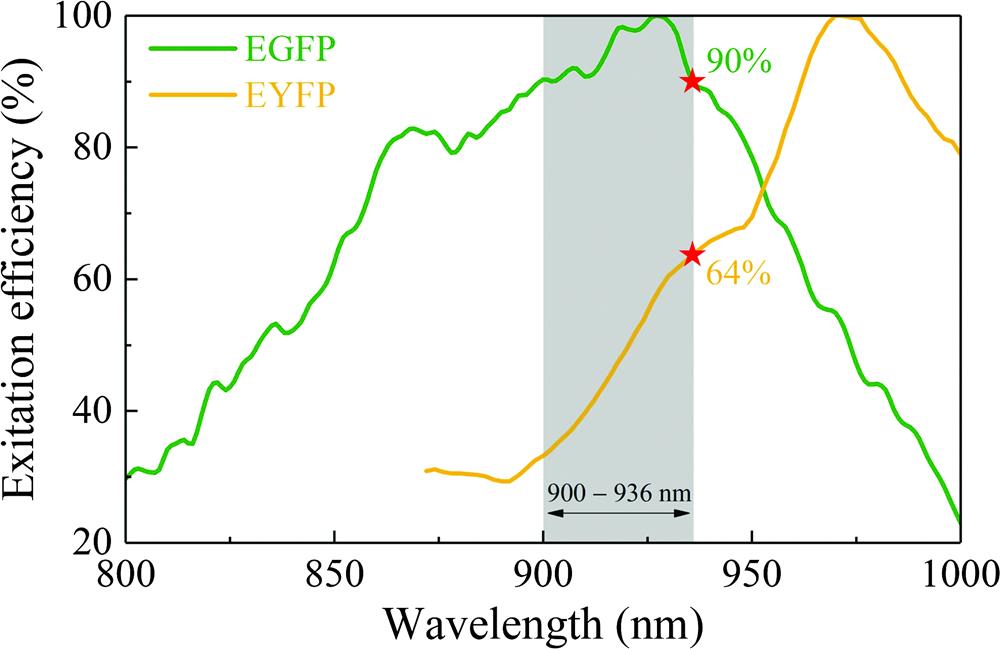
    Fig. 1. Two-photon excitation efficiency of the EGFP and EYFP under the illumination from 800 to 1000 nm.
    (a) Experimental configuration of the all-fiber laser source and the frequency-doubling setup. (b) ASE spectra of the TDFs with different lengths (150, 70, 30, and 10 cm, respectively). (c) ASE spectrum of the 6-cm-long TDF and the reflectance of the SESAM as a function of the wavelength.
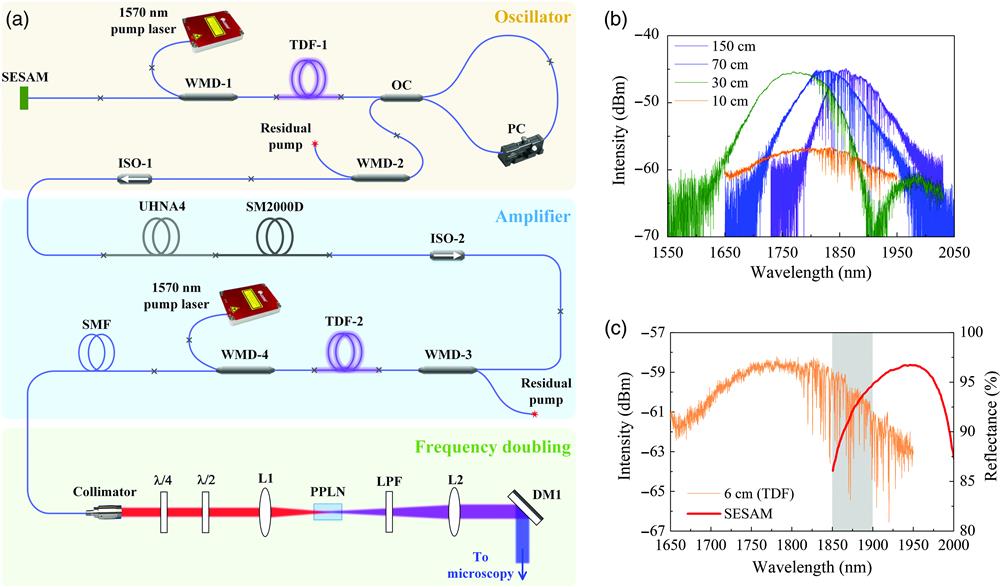
    Fig. 2. (a) Experimental configuration of the all-fiber laser source and the frequency-doubling setup. (b) ASE spectra of the TDFs with different lengths (150, 70, 30, and 10 cm, respectively). (c) ASE spectrum of the 6-cm-long TDF and the reflectance of the SESAM as a function of the wavelength.
    (a) Spectrum of the laser oscillator in the mode-locked state. (b) Pulse train and (c) RF spectrum of the output signal from the laser oscillator. The inset of (c) is the RF spectrum within a 200-MHz span. (d) Average output power as a function of the pump power in the amplifier. (e) Spectrum and (f) pulse width of the amplified signal. (g) Beam profile of the frequency-doubled laser centered at 937 nm. (h) Spectrum and (i) pulse width of the frequency-doubled laser after the PPLN crystal. “a. u.”: arbitrary units.
    Fig. 3. (a) Spectrum of the laser oscillator in the mode-locked state. (b) Pulse train and (c) RF spectrum of the output signal from the laser oscillator. The inset of (c) is the RF spectrum within a 200-MHz span. (d) Average output power as a function of the pump power in the amplifier. (e) Spectrum and (f) pulse width of the amplified signal. (g) Beam profile of the frequency-doubled laser centered at 937 nm. (h) Spectrum and (i) pulse width of the frequency-doubled laser after the PPLN crystal. “a. u.”: arbitrary units.
    (a) Schematic diagram of the 2PM experimental setup with both epi and transmitted detections. GM, galvanometric mirror; L, lens; M, mirror; Obj., objective; Con., condenser; DM, dichroic mirror; F, filters; PMT, photomultiplier tube. (b) Lateral and (d) axial PSFs of the transmitted-detection scheme. (c) The lateral resolution and (e) DOF of the transmitted-detection scheme. (f) Lateral and (h) axial PSFs of the epi-detection scheme. (g) The lateral resolution and (i) DOF of the epi-detection scheme. “a. u.”: arbitrary units.
    Fig. 4. (a) Schematic diagram of the 2PM experimental setup with both epi and transmitted detections. GM, galvanometric mirror; L, lens; M, mirror; Obj., objective; Con., condenser; DM, dichroic mirror; F, filters; PMT, photomultiplier tube. (b) Lateral and (d) axial PSFs of the transmitted-detection scheme. (c) The lateral resolution and (e) DOF of the transmitted-detection scheme. (f) Lateral and (h) axial PSFs of the epi-detection scheme. (g) The lateral resolution and (i) DOF of the epi-detection scheme. “a. u.”: arbitrary units.
    (a)–(d) Two-photon fluorescence images of YFP-labeled neurons and fibers in a mouse brain slice. (e)–(g) Two-photon fluorescence images of Alexa Fluor 488- and Alexa Fluor 568-stained mouse kidney slice. Scale bar: 30 μm. FOV: 150×150 μm. Frame rate: 0.37 Hz (mouse brain) and 0.18 Hz (mouse kidney). Power after obj.: 18 mW (mouse brain) and 13 mW (mouse kidney).
    Fig. 5. (a)–(d) Two-photon fluorescence images of YFP-labeled neurons and fibers in a mouse brain slice. (e)–(g) Two-photon fluorescence images of Alexa Fluor 488- and Alexa Fluor 568-stained mouse kidney slice. Scale bar: 30  μm. FOV: 150×150  μm. Frame rate: 0.37 Hz (mouse brain) and 0.18 Hz (mouse kidney). Power after obj.: 18 mW (mouse brain) and 13 mW (mouse kidney).
    (a) Two-photon fluorescence images of the DiI-stained vasculatures at different depths of the mouse brain. The depth value labeled with “*” denotes an axially projected image: 210*, 160 to 260 μm; 335*, 300 to 370 μm; 445*, 430 to 460 μm; 505*, 480 to 530 μm. The corresponding intensity profile of the blood vessel at the depth of (b) 580 μm and (c) 445 μm. “a. u.”: arbitrary units. (d), (e) Vasculatures of different structures. Scale bar: 30 μm. FOV: 225×225 μm. Frame rate: 0.37 Hz. Power after obj.: 12 mW.
    Fig. 6. (a) Two-photon fluorescence images of the DiI-stained vasculatures at different depths of the mouse brain. The depth value labeled with “*” denotes an axially projected image: 210*, 160 to 260  μm; 335*, 300 to 370  μm; 445*, 430 to 460  μm; 505*, 480 to 530  μm. The corresponding intensity profile of the blood vessel at the depth of (b) 580  μm and (c) 445  μm. “a. u.”: arbitrary units. (d), (e) Vasculatures of different structures. Scale bar: 30  μm. FOV: 225×225  μm. Frame rate: 0.37 Hz. Power after obj.: 12 mW.
    (a) 3D reconstruction of the 2PM images of the EGFP-labeled mouse brain neurons. (b)–(d) Typical images of the neurons located at different depths. (e) 3D images of the GFP-labeled mouse brain vasculature. (f) Typical image of the blood vessel. Scalar bar: 50 μm.
    Fig. 7. (a) 3D reconstruction of the 2PM images of the EGFP-labeled mouse brain neurons. (b)–(d) Typical images of the neurons located at different depths. (e) 3D images of the GFP-labeled mouse brain vasculature. (f) Typical image of the blood vessel. Scalar bar: 50  μm.
    SHG images of the mouse [(a), (b)] skull, [(c), (d)] leg, and [(e), (f)] tail. FOV: 225×225 μm. Frame rate: 0.19 Hz. Power after obj.: 10 mW. Scale bar: 50 μm.
    Fig. 8. SHG images of the mouse [(a), (b)] skull, [(c), (d)] leg, and [(e), (f)] tail. FOV: 225×225  μm. Frame rate: 0.19 Hz. Power after obj.: 10 mW. Scale bar: 50  μm.
    Hongsen He, Huajun Tang, Meng Zhou, Hei Ming Lai, Tian Qiao, Yu-xuan Ren, Cora S. W. Lai, Ho Ko, Xiaoming Wei, Zhongmin Yang, Kevin K. Tsia, Kenneth K. Y. Wong. Deep-tissue two-photon microscopy with a frequency-doubled all-fiber mode-locked laser at 937 nm[J]. Advanced Photonics Nexus, 2022, 1(2): 026001
    Download Citation