
Yingjie Xue, Qi Chen, Songbin Zhou, Yisen Liu, Wei Han. Mechanical Abnormal Sound Detection Based on Self-Supervised Feature Extraction[J]. Laser & Optoelectronics Progress, 2022, 59(12): 1215013
- Laser & Optoelectronics Progress
- Vol. 59, Issue 12, 1215013 (2022)
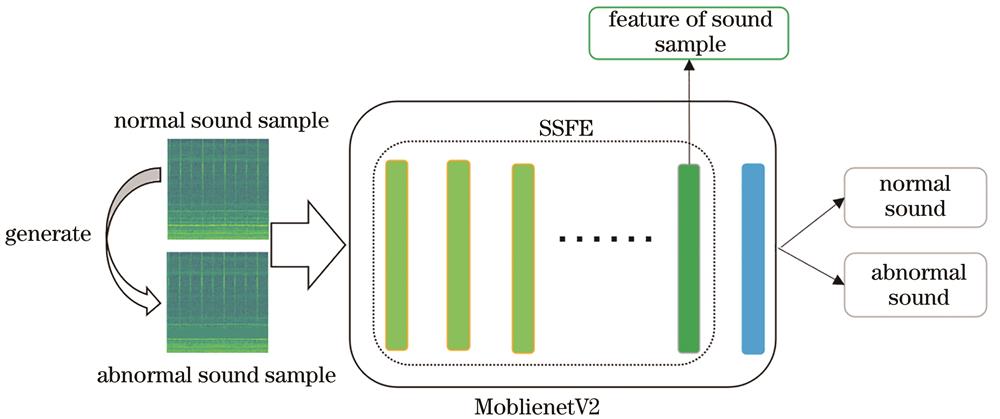
Fig. 1. Process of self-supervised feature extraction
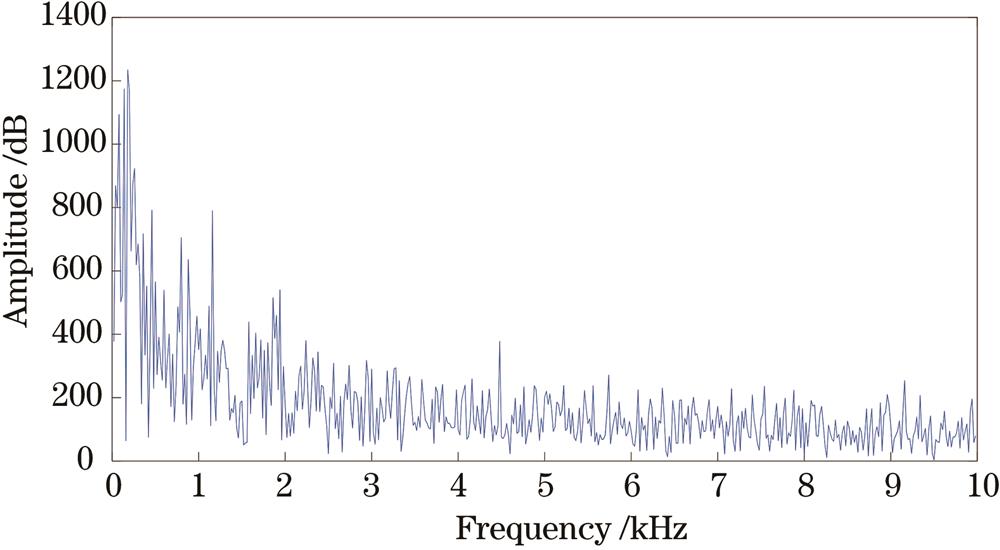
Fig. 2. Power spectrum of pink noise
Fig. 3. Process of pink noise generation by Matlab
Fig. 4. Flowchart of deeply separable convolution
Fig. 5. Structure of Bottleneck module
Fig. 6. Structure diagram of AE
Fig. 7. Flowchart of abnormal sound detection for mechanical equipment
Fig. 8. Time-frequency spectra of test sets of normal sound samples and abnormal sound samples
Fig. 9. Time-frequency spectra of generating abnormal samples
Fig. 10. Visualization of original time-frequency characteristics of test samples
Fig. 11. Visualization of test sample self-supervised feature extraction
Fig. 12. AUC results of six feature extraction methods for anomaly detection
|
Table 1. Network structure of MoblienetV2
|
Table 2. Data partition of four kinds of machine sound
|
Table 3. Performance comparison of different anomaly detection models

Set citation alerts for the article
Please enter your email address
© Copyright 2018-2021 | Chinese Laser Press. All Rights Reserved 沪ICP备15018463号-20