• High Power Laser and Particle Beams
  • Vol. 34, Issue 2, 023002 (2022)
Zhitong Cui, Wei Chen, Yayun Dong, Xin Nie, Wei Wu, and Feng Qin
Author Affiliations
  • State Key Laboratory of Intense Pulsed Radiation Simulation and Effect, Northwest Institute of Nuclear Technology, Xi’an 710024, China
  • show less
    DOI: 10.11884/HPLPB202234.210406 Cite this Article
    Zhitong Cui, Wei Chen, Yayun Dong, Xin Nie, Wei Wu, Feng Qin. Circuit Simulation of GJB151B CS115 Part І: The analysis of calibration equipment indicators[J]. High Power Laser and Particle Beams, 2022, 34(2): 023002 Copy Citation Text show less
    Requirements of calibration setup and waveform in CS115
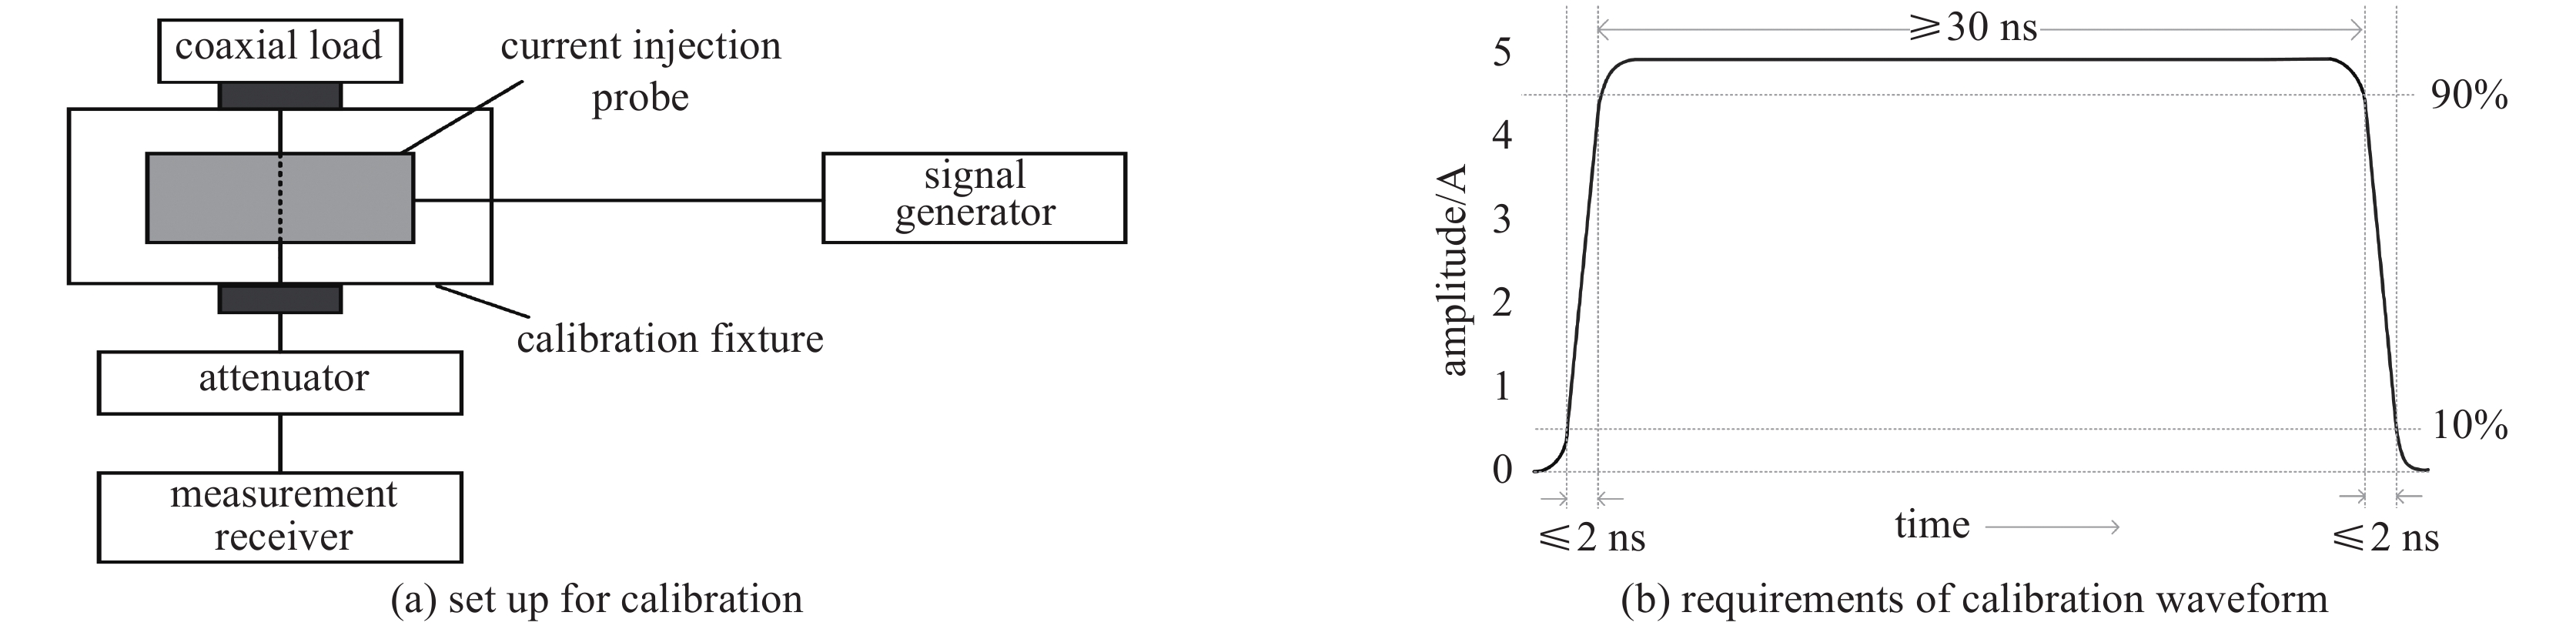
    Fig. 1. Requirements of calibration setup and waveform in CS115
    Circuit model of the calibration platform in CS115
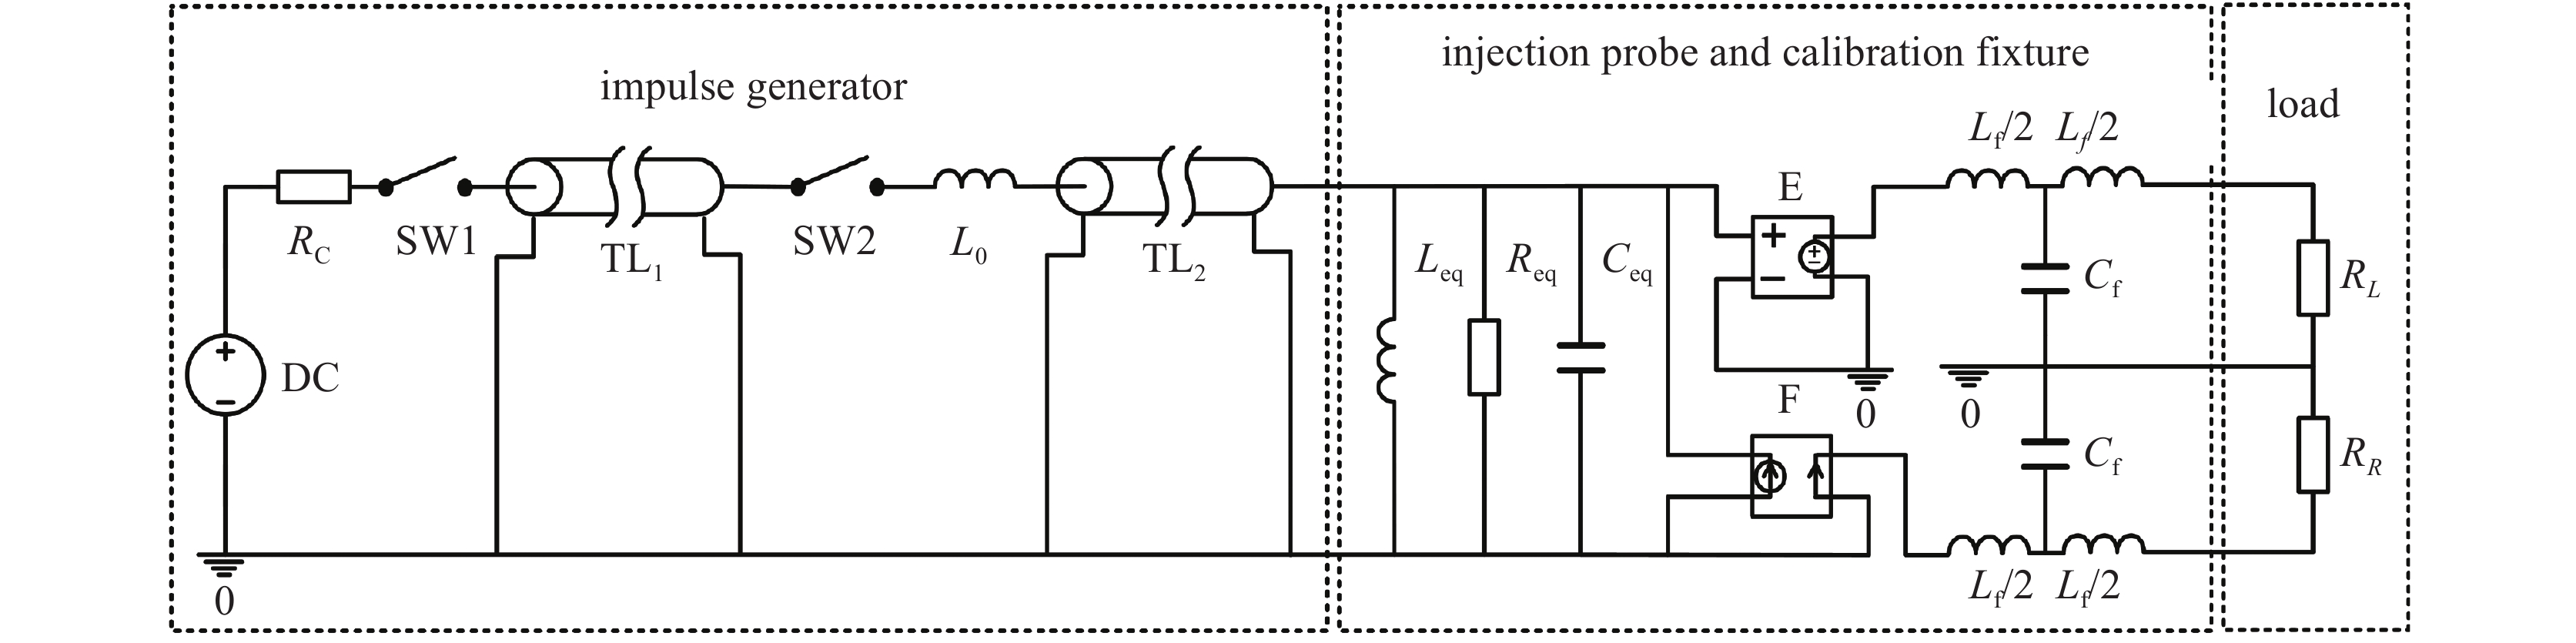
    Fig. 2. Circuit model of the calibration platform in CS115
    Measured and simulated VSWR of FCC-BCICF-1
    Fig. 3. Measured and simulated VSWR of FCC-BCICF-1
    Direct output and calibration waveform under reference setup in simulation
    Fig. 4. Direct output and calibration waveform under reference setup in simulation
    Simulated calibration waveform with different L0 of pulsed current source
    Fig. 5. Simulated calibration waveform with different L0 of pulsed current source
    Simulated calibration waveforms with different Leq
    Fig. 6. Simulated calibration waveforms with different Leq
    Simulated calibration waveforms with different Req
    Fig. 7. Simulated calibration waveforms with different Req
    Simulated calibration waveforms with different Lf and Cf
    Fig. 8. Simulated calibration waveforms with different Lf and Cf
    Regions of current injection probe indicators according to the ferrite-core impedance
    Fig. 9. Regions of current injection probe indicators according to the ferrite-core impedance
    rise time/nsfall time/nsVRE/kVVFE/kVFDR/%
    impulse generator output with 50 Ω load0.71.1110
    L0=32 nH, Req=216 Ω, Leq=17.5 μH1.21.40.590.4917
    inductance of the generatorL0=46 nH1.31.70.580.4916
    L0=60 nH1.52.10.560.4913
    Req of the injection probe modelReq=8 Ω1.31.50.130.128
    Req=32 Ω1.31.50.340.3012
    Req=120 Ω1.21.40.540.4615
    Req=480 Ω1.21.40.640.5317
    Leq of the injection probe modelLeq=2 μH1.21.40.590.2754
    Leq=5 μH1.21.40.590.4032
    Leq=12.5 μH1.21.40.590.4720
    Leq=30 μH1.21.40.590.5114
    Table 1. Indicators of calibration waveform with different L0 , Leq and Req
    Ceq=10 pFCeq=20 pFCeq=30 pFCeq=40 pFCeq=50 pF
    tr/nstp/nstr/nstp/nstr/nstp/nstr/nstp/nstr/nstp/ns
    Req=8 Ω1.31.41.31.51.31.51.41.61.41.6
    Req=32 Ω1.21.41.31.51.41.61.61.81.82.0
    Req=120 Ω1.21.41.31.51.61.81.92.22.42.6
    Req=216 Ω1.11.31.41.51.71.92.12.32.62.9
    Req=400 Ω1.01.31.41.51.71.92.22.42.83.0
    Table 2. The rise time and fall time of calibration waveform with different Req and Ceq
    Zhitong Cui, Wei Chen, Yayun Dong, Xin Nie, Wei Wu, Feng Qin. Circuit Simulation of GJB151B CS115 Part І: The analysis of calibration equipment indicators[J]. High Power Laser and Particle Beams, 2022, 34(2): 023002
    Download Citation