
Woo June Choi, Ruikang K. Wang. Optical coherence tomography imaging of cranial meninges post brain injury in vivo[J]. Chinese Optics Letters, 2017, 15(9): 090005
- Chinese Optics Letters
- Vol. 15, Issue 9, 090005 (2017)
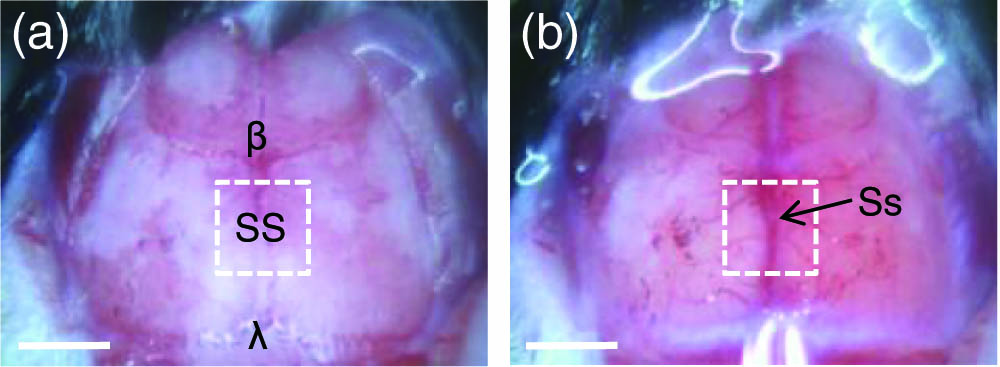
Fig. 1. Photographs of the skull of a C57BL/6 mouse before and after thinned-skull surgery. (a) Baseline of the skull where the skull thinning is applied later to an adjacent region between the two parietal bones including an SS between
![(Color online) Transcranial OCT imaging of a mouse brain before and after skull thinning. (a) OCT cross-section of the mouse brain with intact skull and (b) OCT cross-section of the same mouse brain at 25 min after skull thinning. (c) An overlaid image of (b) (green) and a corresponding OCTA cross-section (orange). (d), (e) Close-up views of boxes in (b) and (c), respectively. High reflective particles in SDS [arrows in (d)] and blood Vs in DM [arrows in (e)] are highlighted. S, skull. Scale bars = 100 μm.](/richHtml/col/2017/15/9/090005/img_002.jpg)
Fig. 2. (Color online) Transcranial OCT imaging of a mouse brain before and after skull thinning. (a) OCT cross-section of the mouse brain with intact skull and (b) OCT cross-section of the same mouse brain at 25 min after skull thinning. (c) An overlaid image of (b) (green) and a corresponding OCTA cross-section (orange). (d), (e) Close-up views of boxes in (b) and (c), respectively. High reflective particles in SDS [arrows in (d)] and blood Vs in DM [arrows in (e)] are highlighted. S, skull. Scale bars = 100 μm.
Fig. 3. (Color online) (a) Transcranial OCT cross-sections of mouse brain obtained at 17, 32, and 82 min post skull thinning. (b) Enlargements of boxed areas in (a). The mechanical change in the meningeal spaces is evident at different time points. Scale bars: 20 μm.
Fig. 4. (Color online) Process for volume measurement of meningeal spaces. (a) An original OCT image. (b) OCT image after applying light attenuation compensation to (a). (c) OCT image after applying tissue segmentation to (b). (d) A binary image of the segmented region in (c). (e) Overlay of the white area in (d) with (a). (f) A rendered image of the meningeal spaces.
Fig. 5. (Color online) (a) Rendered images of the reconstructed meningeal spaces in alteration with time. Gradual loss in the meningeal cavity structure means progressive closing of the meningeal spaces. (b) Meningeal space volume change over time for five mice with skull thinning preparations.
Fig. 6. (Color online) Top: transcranial OCT angiograms (

Set citation alerts for the article
Please enter your email address
© Copyright 2018-2021 | Chinese Laser Press. All Rights Reserved 沪ICP备15018463号-20