Woo June Choi and Ruikang K. Wang*
Abstract
We report a new application of optical coherence tomography (OCT) to investigate the cranial meninges in an animal model of brain injury in vivo. The injury is induced in a mouse due to skull thinning, in which the repeated and excessive drilling exerts mechanical stress on the mouse brain through the skull, resulting in acute and mild brain injury. Transcranial OCT imaging reveals an interesting virtual space between the cranial meningeal layers post skull thinning, which is gradually closed within hours. The finding suggests a promise of OCT as an effective tool to monitor the mechanical trauma in the small animal model of brain injury.Traumatic brain injury (TBI) is a major cause of injury, death, and lifelong disability worldwide[1]. TBI occurs as a series of consequences of an impact upon the head by a sudden violent blow or jolt to the head. The injury process in TBI is classified into primary brain injury and secondary brain injury[2]. Primary brain injury occurs at the moment of initial impact, inducing brain bruise, tearing of nerve fibers, and ruptures of cerebral veins causing blood collection in the brain due to intracranial bleeding (hematoma). Secondary injury caused by the primary brain injury collectively exacerbates brain trauma from minutes to days, involving complex pathological cascades, including raised intracranial pressure (ICP), alteration in cerebral blood flow (CBF), brain swelling (edema), and neuronal damage in the brain tissue, which eventually contribute to permanent impairment of cognitive, behavioral, and psychosocial functions in the brain[2]. The understanding of these pathogenic injury processes is still incomplete, and accordingly no effective and appropriate neuroprotective treatment or therapy is available[3].
Over the decades, many animal models of TBI have been developed to mimic the pathological features associated with brain injury in humans[4]. The use of the TBI model is essential for better understanding of the underlying pathophysiology in order to develop novel therapeutic strategies. To study the animal model’s high-resolution optical imaging techniques have been required to detect subtle cerebral changes post head injury in vivo. Transcranial two photon microscopy (TPM) has been commonly used for TBI studies, allowing for the observation of disruption in the neurons, non-neuronal cells, and cortical vessels (Vs) superficial to the mouse cortex through the thinned skull during the acute or chronic TBI phase[5]. Recently, optical coherence tomography (OCT) has been used to image the mouse models of TBI with its capacity for label-free high-resolution sensing of optical contrast at depths beyond an optical mean-free path ( below the mouse brain surface)[6,7]. A few studies have evidenced the possibility of OCT for detecting microscopic injury characteristics in the mouse brain. For example, Rodriguez et al. have studied light scattering changes in the cerebral cortex (C) in mice suffering from acute cerebral edema that develops in response to TBI[6]. Jia et al. have utilized optical microangiography (OMAG), a type of OCT angiography (OCTA) capable of imaging blood perfusion, to monitor the alteration of CBF in the TBI model of mice with the cranium left intact[7].
To date, most of the brain injury studies using OCT have been dedicated to the brain cortex, whereas its effect on the meninges of the brain has been poorly studied. Meninges are membranes covering the central nervous system (CNS), such as the brain and spinal cord, consisting of three connective tissue layers: dura mater (DM, outermost from the CNS), arachnoid mater (AM), and pia mater (innermost to the CNS)[8]. Clinically, the cranial meninges are intimately involved in the deformation and rupture of the cerebral Vs after the head injury, from which the injury is often identified by the presence of intracranial bleeding[9]. Thereby, investigating the meninges would be also helpful to the understanding of TBI pathophysiology.
Sign up for Chinese Optics Letters TOC. Get the latest issue of Chinese Optics Letters delivered right to you!Sign up now
In this Letter, we first demonstrate a feasibility of OCT for the investigation of the cranial meninges in a mouse model of brain injury in vivo. A mild injury is initiated on the mouse brain, and its cranial meninges are examined through the mouse skull. The time lapse transcranial OCT imaging reveals visible alteration in the meninges post brain injury.
In order to identify the thin cranial meninges (a few tens of micrometers in thickness), we employed a high-resolution OCT system. The system was described in our previous work[10]. In brief, a supercontinuum white light laser (SuperK Versa, NKT Photonics) was used as a broad-band spectral domain OCT light source, whose Gaussian spectrum had a center wavelength of 820 nm and a spectral bandwidth of 120 nm, providing an effective axial resolution of 3 μm in air (2.2 μm in tissue). The spectral interferogram formed between the reference and sample lights was projected onto a 140 kHz line scan CMOS camera (spL2048-140 km, Basler) in a detection spectrometer through a transmission grating and a collimator for producing a depth-profile. A lateral resolution was measured as 9 μm, owing to a 10 times objective lens (LSM02, Thorlabs). The system sensitivity was around a zero-delay line, falling off to 75 dB at a ranging distance. The average incident optical power to the sample surface was measured as .
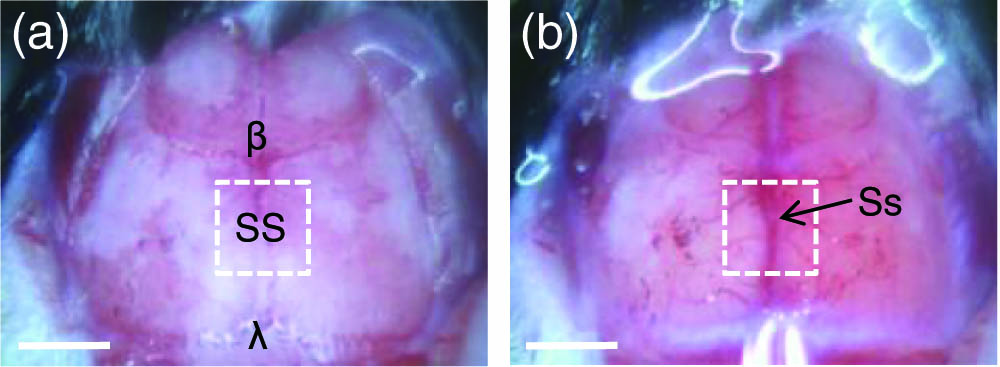
To create brain injury, in this work, we performed skull thinning as a mild brain injury method. The skull thinning has been largely used to access the brain for imaging applications of TPM and OCT in place of a traditional craniotomy, which has its own merit of being minimally invasive. However, the skull thinning procedure provides an opportunity for mechanical stress to disrupt the underlying brain[11]; unskilled thinning or excessive thinning (less than 30 μm in thickness) of a skull may carry the risk of brain injury resulting from shaking or overpressing of the skull against the brain. Thus, the skull thinning could induce possible acute brain injury. In preparation of the brain injury model, five wild-type young adult mice (C57BL/6) were used. The mice were anesthetized with the inhalation of isoflurane (5% for induction, 1.5% for surgery) via a nose cone and placed on a surgery frame. After the removal of the scalp and underlying periosteum from the skull bone, the exposed skull surface was immediately covered with a piece of plastic wrap to preserve the skull integrity. The mouse head was firmly secured using a pair of ear bars in a frame to eliminate motion artifacts induced by breathing and heartbeat. Prior to the thinned-skull surgery, the skull was subjected to a baseline OCT imaging, where a scanned area () was chosen to an adjacent region of the two parietal bones [a dotted box in Fig. 1(a)], including a sagittal suture (SS) between bregma () and lambda ().

Figure 1.Photographs of the skull of a C57BL/6 mouse before and after thinned-skull surgery. (a) Baseline of the skull where the skull thinning is applied later to an adjacent region between the two parietal bones including an SS between and . (b) The skull underwent the skull thinning, being identified as an Ss running along the SS and its branch Vs under the skull thinned area. Dotted boxes indicate OCT scan regions (), which is almost same as the thinned area. Scale bars: 2 mm.
After the OCT baseline imaging was taken, the surgery was performed on the scanned area based on the surgical procedures similar to those described in a previous paper[12]. The skull was thinned with drilling at the drill speed of 3200 rpm, and the thinning was stopped every 20 s to remove bone dust and to avoid overheating the skull. To control the skull thickness to less than 30 μm, the thickness of the thinned skull was measured every drilling using a handheld probe of an another OCT system (OCS1310V1, Thorlabs). After completion of the skull thinning, cerebral transparency was identified from visual observation of a superior sagittal sinus (Ss) running along the SS and its branch Vs through the cranium [Fig. 1(b)]. Transcranial OCT imaging was then repeated on the thinned area [a dotted box in Fig. 1(b)]. The thinned area was rinsed with a sterile saline every one minute during the imaging to keep the skull surface wet. The choice of the adjacent area between the parietal bones was intended to observe intracranial hemorrhage following skull thinning. This region contains many straight veins bridging between the superior Ss and the DM. Because the bridging veins are vulnerable to high tension, the excessive skull thinning can induce strong skull movement against the underlying brain, and, subsequently, the bridging veins can be easily stretched or even torn by the mechanical stress, resulting in bleeding into the meninges[13].
For OCT imaging, we used the OMAG to obtain both the brain tissue structure and vasculature information[14]. This OCTA technique can separate moving (blood) and static (tissue) scattering elements within the vascularized tissue, enabling precise localization of blood perfusion in the 3D tissue structure. In the scan protocol, the B scan (400 A-lines) was repeated five times at the same position, and this manner was performed along 400 different locations in the C scan, producing a total of 2000 B scans in 8 s. OCT and OCTA cross-sections were constructed from the acquired five ensemble B scans for each position using the OMAG algorithm[14]. Finally, the OCTA cubic data was converted to a 2D en face projection () for ease in the observation of microvessel networks. All procedures for this study were reviewed and approved by the Institution Animal Care and Use Committee of the University of Washington, Seattle, WA.
Figure 2(a) shows a representative OCT cross-section of the intact skull, depicting the intracranial anatomy. High reflective thin strands between the skull and the C are the DM and the underlying AM, making up the meningeal layers, which are tightly attached each other[8]. The OCT signal at the C is relatively weak because of strong light attenuation of the overlying high scattering skull tissue. The skull thinning can increase the light penetration through the cortex but with the risk of brain injury. Figure 2(b) is an OCT cross-section of the same mouse brain at 25 min after skull thinning. It was observed at an opening between the DM and the AM, where they should have tightly attached at the normal state, as in Fig. 2(a). This virtual cavity may be a subdural space (SDS) that is mainly created by an acute subdural hematoma, resulting from the rupture of bridging veins[13]. Another possible reason for the creation of space might be traumatic tearing of the AM, allowing passage of cerebrospinal fluid (CSF) into the SDS[15]. However, another cavity between the AM and the pia mater (not shown here) is the subarachnoid space (SAS). This anatomical cavity is usually filled with colorless CSF to flow around the brain and contains large blood V, serving several vital functions in the CNS, such as mechanical and immunological protection of the brain. It is interesting to observe strong reflective particles in the SDS. They are highlighted from a close-up view [Fig. 2(d)] of a boxed area in Fig. 2(b) (see arrows). These scatters are expected to be either blood cells or immune cells from the venous bleeding or the CSF leakage, respectively. Figure 2(c) is an overlay of the OCT image [Fig. 2(b)] (green) with its OCTA image (orange) exhibiting functional blood Vs. An enlargement [Fig. 2(e)] of a boxed area in Fig. 2(c) shows big surface Vs under the avascular AM and a few small Vs (arrows) in the DM. There are pseudo OCTA signals in the AM. This is because of the tail effect by forward scattering through the DM Vs[16]. The OCT anatomy is well correlated with a histology of animal meninges[17].
Figure 2.(Color online) Transcranial OCT imaging of a mouse brain before and after skull thinning. (a) OCT cross-section of the mouse brain with intact skull and (b) OCT cross-section of the same mouse brain at 25 min after skull thinning. (c) An overlaid image of (b) (green) and a corresponding OCTA cross-section (orange). (d), (e) Close-up views of boxes in (b) and (c), respectively. High reflective particles in SDS [arrows in (d)] and blood Vs in DM [arrows in (e)] are highlighted. S, skull. Scale bars = 100 μm.
In order to observe the change in SDS, the meninges were monitored every 5 min post skull thinning. Figure 3(a) shows three time lapse OCT cross-sections of the thinned skull taken from 17, 32, and 82 min after skull thinning. At 17 min, the SDS was already opened, and it peaked 15 min later. Then, the opening was gradually closed in up to 2 h. The mechanical change of meninges is apparent from close-up views [Fig. 3(b)] of boxes in Fig. 3(a). Quantification of the mechanical change would be helpful in evaluating the severity or development of the brain injury. For this, we measured the meningeal space volume. Figure 4 illustrates a process for the volume measurement. First, the original OCT image [Fig. 4(a)] was corrected using the light attenuation compensation method to eliminate shadow casts appearing below the strongly attenuating structures, such as big Vs and local scatters in the skull[18]. The compensation provided successful shadow removal and enhanced visibility of the spaces from the surroundings, as in Fig. 4(b). A segmentation method was then applied to the compensated image to separate the region involving the meninges from the brain tissue and the cranium, as in Fig. 4(c)[19]. After the segmentation, the segmented region was binarized [Fig. 4(d)]. The binary area (white) was confirmed to be meningeal spaces from an overlay with the OCT image [Fig. 4(e)]. As the process being performed for all of the OCT cross-sections, eventually the meningeal spaces could be reconstructed, as in Fig. 4(f). A volume of the spaces was calculated from a product of the total number of pixels in the reconstructed meningeal spaces with a voxel size [].
Figure 3.(Color online) (a) Transcranial OCT cross-sections of mouse brain obtained at 17, 32, and 82 min post skull thinning. (b) Enlargements of boxed areas in (a). The mechanical change in the meningeal spaces is evident at different time points. Scale bars: 20 μm.
Figure 4.(Color online) Process for volume measurement of meningeal spaces. (a) An original OCT image. (b) OCT image after applying light attenuation compensation to (a). (c) OCT image after applying tissue segmentation to (b). (d) A binary image of the segmented region in (c). (e) Overlay of the white area in (d) with (a). (f) A rendered image of the meningeal spaces.
Furthermore, we evaluated volume change in the meningeal spaces for five mice with skull thinning preparations. Figure 5(a) displays time course change in the reconstructed meningeal spaces, in which some portion of the meningeal cavity structure was increasingly lost over time, representing progressive closing of the space. The volume change was graphically represented in Fig. 5(b). The graph exhibits a common decreasing aspect in the volume change for all the mice with inter-individual variation in the duration time and magnitude. The variation may be due to different impacts upon the brain for each animal because of mechanical instability in the skull thinning, depending on the surgical skill of the operator.
Figure 5.(Color online) (a) Rendered images of the reconstructed meningeal spaces in alteration with time. Gradual loss in the meningeal cavity structure means progressive closing of the meningeal spaces. (b) Meningeal space volume change over time for five mice with skull thinning preparations.
In addition, we examined the effect of the current brain injury model on cerebral microcirculation. Figures 6(a)–6(c) show transcranial OCT angiograms obtained at 5, 10, and 40 min post skull thinning, delineating cerebral microvasculatures, such as Ss, surface veins, and capillaries. A partial signal loss along the Ss is attributed to strong shadowing by high scattering at the SS. Figures 6(d)–6(f) are overlays of the OCT (green) and OCTA (orange) cross-sections taken from the same position (sold lines) in Figs. 6(a)–6(c). In appearance, no significant vascular change was observed in the OCT angiograms over the time duration when the SDS was opened and closed. This indicates that the brain injury by skull thinning would not lead to critical disruption in the cerebral microcirculation. However, additional Doppler OMAG imaging would be useful to examine the influence of brain injury on the CBF velocity[12].
Figure 6.(Color online) Top: transcranial OCT angiograms () of the thinned skull at (a) 5, (b) 10, and (c) 40 min after skull thinning. Bottom: overlaid images of OCT (green) and OCTA (orange) cross-sections taken at the same location marked as solid lines in the each figure (a–c). Scale bars: 500 μm.
In conclusion, we demonstrate one useful application of OCT to investigate brain trauma in the intracranial structures. Transcranial high-resolution OCT imaging of the mouse brain visualizes and quantifies mechanical alteration in the cranial meninges after skull thinning. This initial study suggests that the OCT approach would be helpful for investigating the initiation and development of the primary brain injury in the small animal models of TBI.
References
[1] B. Roozenbeek, A. I. R. Maas, D. K. Menon. Nat. Rev. Neurol., 9, 231(2013).
[2] M. Gaetz. Clin. Neurophysiol., 115, 4(2004).
[3] Y. Xiong, A. Mahmood, M. Chopp. Expert Opin. Emerg. Drugs, 14, 67(2013).
[4] C. Albert-Weissenberger, A. L. Sirén. Exp. Transl. Stroke Med., 2, 16(2010).
[5] T. L. Roth, D. Nayak, T. Atanasijevic, A. P. Koretsky, L. L. Latour, D. B. McGavern. Nature, 505, 223(2014).
[6] C. L. R. Rodriguez, J. I. Szu, M. M. Eberle, Y. Wang, M. S. Hsu, D. K. Binder, B. H. Park. Neurophotonics, 1, 025004(2014).
[7] Y. Jia, N. J. Alkayed, R. K. Wang. J. Biomed. Opt., 14, 040505(2009).
[8]
[9] A. G. Kolias, A. Chari, T. Santarius, P. J. Hutchinson. Nat. Rev. Neurol., 10, 570(2014).
[10] W. Qin, U. Baran, R. K. Wang. Lasers Surg. Med., 47, 669(2015).
[11] R. D. Dorand, D. S. Barkauskas, T. A. Evans, A. Petrosiute, A. Y. Huang. Intravital, 3, e29728(2014).
[12] Y. Li, U. Baran, R. K. Wang. PLoS One, 9, e113658(2014).
[13] T. Yamashima, R. L. Friede. J. Neurol. Neurosurg. Psychiatry, 47, 121(1984).
[14] S. Yousefi, Z. Zhi, R. K. Wang. IEEE Trans. Biomed. Eng., 58, 2316(2011).
[15] R. A. Kristof, J. M. Grimm, B. Stoffel-Wagner. J. Neurosrug., 108, 275(2008).
[16] U. Baran, W. J. Choi, Y. Li, R. K. Wang. J. Biophoton.(2016).
[17]
[18] M. J. A. Girard, N. G. Strouthidis, C. R. Ethier, J. M. Mari. Invest. Ophthalmol. Vis. Sci., 52, 7738(2011).
[19] X. Yin, J. R. Chao, R. K. Wang. J. Biomed. Opt., 19, 086020(2014).