
RAI Raju, PAUDEL Basanta, Changjun GU, Raj KHANAL Narendra. Change in the Distribution of National Bird (Himalayan Monal) Habitat in Gandaki River Basin, Central Himalayas[J]. Journal of Resources and Ecology, 2020, 11(2): 223
- Journal of Resources and Ecology
- Vol. 11, Issue 2, 223 (2020)
Abstract
1 Introduction
The International Panel on Climate Change (IPCC) has reported that the global temperature is likely to increase by about 1.5℃ between 2030 and 2052 (
The changes in climate have exacerbated habitat loss and fragmentation in different ecological regions globally; and these changes have already impacted 54% of important terrestrial species during the 21st century (
The Himalayan region is a shelter for numerous species (
2 Materials and methods
2.1 Selection of the study area
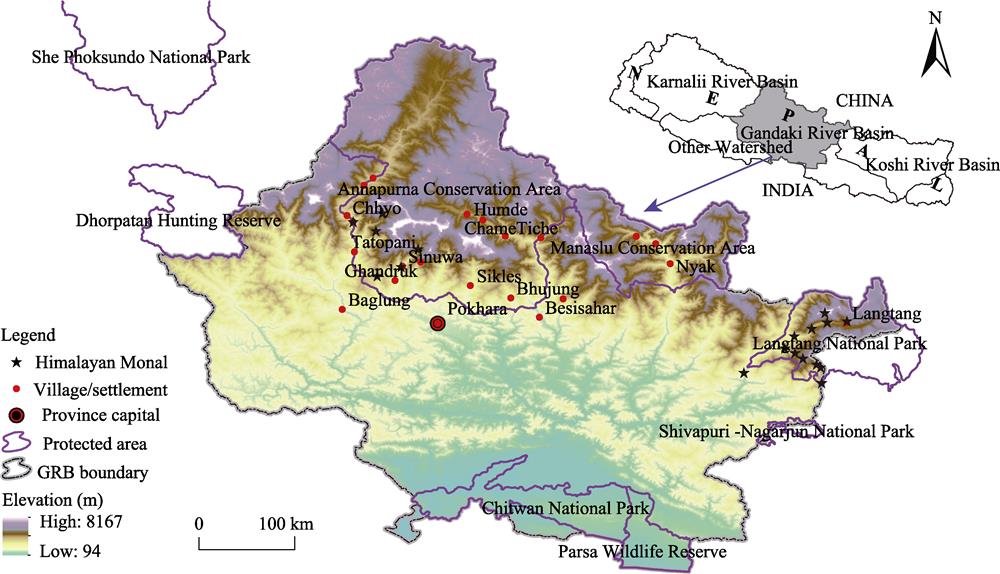
GRB is located between 28.35°N and 29.33°N and between 82.87°E and 85.80°E. The basin covers around 32807 km2 of the central Himalayan region (
of mammals, birds, and reptiles are found (
![]()
Figure 1.Location of the GRB and species occurrences
2.2 Datasets
2.2.1 Species occurrence
The points of known HM occurrences were extracted from the Global Biodiversity Information Facility (GBIF) portal (http://www.gbif.org/), a platform which provides more than 280 million records of different species observations worldwide (
2.2.2 Bioclimatic variables
The bioclimatic variables (at 30 arc-second spatial resolution) were extracted from WorldClim: http://www.worldclim.org/ (
| Variable | Description | Retained or | |
|---|---|---|---|
| Climate | Bio 1 | Annual mean temperature | √ |
| Bio 2 | Mean diurnal range | √ | |
| Bio 3 | Isothermality | √ | |
| Bio 4 | Temperature seasonality | √ | |
| Bio 5 | Max temperature of warmest month | √ | |
| Bio 6 | Min temperature of coldest month | √ | |
| Bio 7 | Temperature annual range (Bio 5, 6) | × | |
| Bio 8 | Mean temperature of wettest quarter | √ | |
| Bio 9 | Mean temperature of driest quarter | × | |
| Bio 10 | Mean temperature of warmest quarter | √ | |
| Bio 11 | Mean temperature of coldest quarter | × | |
| Bio 12 | Annual precipitation | √ | |
| Bio 13 | Precipitation of wettest month | × | |
| Bio 14 | Precipitation of driest month | √ | |
| Bio 15 | Precipitation seasonality | √ | |
| Bio 16 | Precipitation of wettest quarter | √ | |
| Bio 17 | Precipitation of driest quarter | √ | |
| Bio 18 | Precipitation of warmest quarter | √ | |
| Bio 19 | Precipitation of coldest quarter | √ | |
| Topography | Elevation, slope, aspect | √ | |
| Land cover | Land cover data at 30 m spatial resolution | √ | |
Table 1.
Environmental variables and their descriptions
2.2.3 Land cover data
National land cover data for 1990 were download from the International Centre for Integrated Mountain Development (ICIMOD) (http://rds.icimod.org). Similarly, land cover data for 2010 were extracted from Uddin et al. (2015). Based on the 1990 and 2010 data, land cover data for 2050 were simulated using a Cellular Automata (CA) Markov model in TerraSet version 18.21. The Markov model is often used for projecting future land cover changes (
2.3 Maximum Entropy (MaxEnt) model
The freely available MaxEnt version 3.4.1 software was used in this study. This model identifies wild species’ environmental requirements and geographical distributions (
This study categorized habitat suitability by defining five classes: Very high suitability (greater than 70% probability); High suitability (from 50% to 70% probability); Medium suitability (from 30% to 50% probability); Low suitability (from 10% and 30% probability); and Very low suitability (less than 10% probability) (
3 Results
3.1 Land cover changes
Based on land cover data for 1990 and 2010, the CA Markov model was used to predict land cover data for 2050. This model predicts that agricultural land, shrubland and built-up areas are likely to increase in the future, while forest cover, grassland, barren land and water body area would decrease by 2050 (
| LULC types | 2010 | 2050 | ||
|---|---|---|---|---|
| Area | Percentage (%) | Area | Percentage (%) | |
| Forest | 13174 | 40.15 | 11344 | 34.58 |
| Shrubland | 821 | 2.50 | 1072 | 3.27 |
| Grassland | 3798 | 11.58 | 3366 | 10.26 |
| Agricultural land | 7574 | 23.09 | 8379 | 25.54 |
| Barren land | 3284 | 10.01 | 3147 | 9.59 |
| Water body | 168 | 0.51 | 115 | 0.35 |
| Snow/Glacier | 3887 | 11.85 | 5218 | 15.91 |
| Built-up area | 101 | 0.31 | 166 | 0.51 |
| Total | 32807 | 100 | 32807 | 100 |
Table 2.
Current (2010) and projected (2050) land use and land cover (LULC) types
The results show that the predominant forest cover is likely to decrease in each of the elevation ranges, while the shrubland is likely to increase at elevations up to 3750 m (
![]()
Figure 2.Current (a, 2010) and projected (b, 2050) LULC
![]()
Figure 3.Land cover changes along the altitudinal gradient
3.2 Model evaluation and analysis of variables
In setting-up the MaxEnt model, 25% of the occurrence locations were used for testing and the remaining randomly selected 75% were used to train the model. This process found the area under the Receiver Operating Characteristics (ROC) curve, or mean Area Under ROC (AUC) test set data, to be 0.920. The overall accuracy of the model performance was high, which indicates that the distributions generated provide close estimations for the real-world distribution probabilities.
The environmental variables are fundamental to MaxEnt modeling and each one contributes to the spatial distribution of habitat. Different environmental variables play important roles in explaining whether or not the species exists in a particular area. Thus, if any environmental layer provides a higher contribution, then it represents a higher impact of the variables on the habitat prediction. The result shows that climatic layer Bio 8 (mean temperature of wettest quarter) provided the highest contribution to the HM, corresponding to 29%. Two others, Bio 14 (precipitation of driest month) (12%) and elevation (9%) were also found to be important variables contributing to the habitat of HM (
![]()
Figure 4.Environmental variables and contributions Note: See
3.3 Habitat status and future distributions
Under the appropriate conditions of the climatic variables, topography and land cover, the modeling results reveal the suitable habitat across the GRB. The total area of HM habitat is projected to increase by 695 km2 in the future, with corresponding decreases and stable areas projected to be 3177 km2 and 995 km2, respectively, in the future (
![]()
Figure 5.Projected habitat changes of HM within the GRB in the future (by 2050)
This study assessed the habitat suitability according to five classes: very high suitability (啊啊啊70% probability); high suitability (50%-70% probability); medium suitability (30%-50% probability); low suitability (10%-30% probability); and very low suitability (嗯嗯嗯10% of probability) (
| Habitat suitability | Current | Future |
|---|---|---|
| Very high | 748.50 | 560.54 |
| High | 1532.99 | 846.76 |
| Medium | 2625.70 | 1849.90 |
| Low | 4520.88 | 9201.65 |
| Very low | 23379.74 | 20349.06 |
Table 3.
The suitability status of current and predicted future habitat areas (km2)
![]()
Figure 6.Current (a) and predicted (b) habitat distributions in the GRB
3.4 Habitat changes along the altitudinal gradient
This study assessed the very high suitability area of greater than 70% prediction probability as it was mapped at different altitudes in the future. The habitat of HM is likely to decrease at elevations between 1750 m and 3750 m, and between 4500 m and 5500 m, while at elevation ranges from 3750 to 4500 m it will likely increase in the future. Overall, the projections found around 186 km2 of total area loss within these elevation ranges (
![]()
Figure 7.Changes in very high suitability habitat at different elevation ranges in the GRB
4 Discussion: The potential impact of climate and land cover changes on habitat of HM
Currently, the HM is estimated to occur within less than 20000 km2 area globally, including Nepal, India, Bhutan, Afghanistan, Pakistan, Tibet and Myanmar (
The habitat of HM is also projected to decrease at elevations between 1750 m and 3750 m, and to increase at elevations between 3750 m and 4500 m. Past studies also found the suitable habitat ranges between 2500 m and 4750 m in barren land and open forest of the Nepal Himalayan regions (
This species undergoes fluctuations with altitudinal and seasonal migrations (
5 Conclusions
This study assessed the current and future distributions of the habitat of the nationally protected bird, Himalayan Monal, within the GRB using the MaxEnt model. Under the conditions of changing climatic variables, land cover changes were found likely to impact the habitat of the Himalayan Monal in 2050. The highly suitable habitat of the Himalayan Monal is likely to decrease by around 188 km2 in the future, particularly in the northern and northwestern parts (i.e., Chhyo, Tatopani, Humde and Chame). For the most part, the suitable habitat would increase in the eastern parts such as Nyak, Langtang, Langtang National Park and Manaslu Conservation Area in 2050. This study highlights the fact that more attention should be given to HM, in terms of future habitat protection. This species is expected to experience considerable decreases in suitable habitat areas in the future. The northeast parts are particularly important regions and more attention should be paid to them, especially with regard to forest cover, grassland, and shrubland to protect the remaining habitat of HM.
References
[1] AcharyaB, CaoC, XuM et al. Present and future of dengue fever in Nepal: Mapping climatic suitability by ecological niche model. International Journal of Environmental Research and Public Health, 15, 1-16(2018).
[2] AhmadB, NoorF, AwanM et al. Distribution and population status of Himalayan Monal pheasant (. Lophophorus impejanus) in Salkhala game reserve, Neelum valley Azad Jammu and Kashmir (Pakistan). The Journal of Animal Plant Science, 29, 1150-1159(2019).
[3] BaldwinR. Use of maximum entropy modeling in wildlife research. Entropy, 11, 854-866(2009).
[4] BaralH. Protected birds of Nepal: A review of their status, distribution and habitat. The Initiation, 9, 66-80(2009).
[5] Important bird areas in Nepal deliver vital ecosystem services to people. Kathmandu:. Bird Conservation Nepal.(2013).
[6] The state of Nepal’s Birds 2010. Kathmandu: Bird Conservation Nepal and Department of National Parks and. Wildlife Conservation.(2011).
[7] BeckJ, Ballesteros-MejiaL, NagelP et al. Online solutions and the ‘W allacean shortfall’: What does GBIF contribute to our knowledge of species' ranges?. Diversity and Distributions, 19, 1043-1050(2013).
[8] BhattacharyaT, SathyakumarS, RawatG. Distribution and abundance of Galliformes in response to anthropogenic pressures in the buffer zone of Nanda Devi Biosphere Reserve. International Journal of Galliformes Conservation, 1, 78-84(2009).
[10] BrambillaM, ScridelD, BazziG et al. Species interactions and climate change: How the disruption of species co-occurrence will impact on an avian forest guild. Global Change Biology, 26, 1212-1224(2020).
[11] Chhetri PK, Gaddis KD, Cairns DM. Predicting the suitable habitat of treeline species in the Nepalese Himalayas under climate change. Mountain Research and Development, 38, 153-163(2018).
[12] del Rosario AvalosV, HernándezJ. Projected distribution n shifts and protected area coverage of range-restricted Andean birds under climate change. Global Ecology and Conservation, 4, 459-469(2015).
[13] Dirnb?ckT, EsslF, RabitschW. Disproportional risk for habitat loss of high-altitude endemic species under climate change. Global Change Biology, 17, 990-996(2011).
[14] Protected areas of Nepal. Department of National Parks and Wildlife Conservation, Ministry of Forests and Soil Conservation, Kathmandu. Nepal.(2018).
[15] Birds of Nepal: An official checklist. Department of National Parks and Wildlife Conservation and Bird Conservation Kathmandu. Nepal.(2018).
[16] Forrest JL, WikramanayakeE, ShresthaR et al. Conservation and climate change: Assessing the vulnerability of snow leopard habitat to treeline shift in the Himalaya. Biological Conservation, 150, 129-135(2012).
[17] GanasriB, RajuA, DwarakishG. Different approaches for land use land cover change detection: A review. Journal of Engineering and Technology, 2, 44-48(2013).
[18] GrimmettR, InskippC, InskippT, et al.2016. Birds of Nepal (revised edition). Christopher Helm, London, UK: Bloomsbury Publishing.
[19] GuC, ZhangY, LiuL et al. Comprehensive evaluation of the suitability of agricultural land in Myanmar. Journal of Resources and Ecology, 9, 609-622(2018).
[20] Heumann BW, Walsh SJ, McDaniel PM. Assessing the application of a geographic presence-only model for land suitability mapping. Ecological informatics, 6, 257-269(2011).
[21] HofmeisterE, Rogall GM, WesenbergK et al. Climate change and wildlife health: Direct and indirect effects. Rep. No. 2327-6932. US Geological Survey.(2010).
[22] InskippC, BaralH. 2013. Danphe--A nationally threatened species? In: Danphe, Bird Conservation Nepal, 22, 1-12.
[23] InskippC, BaralH, PhuyalS et al. The status of Nepal’s birds: The national red list series. Vol. 1, Zoological Society of London. UK.(2016).
[24] InskippC, InskippT. A guide to the birds of Nepal (Second edition), London, UK: Christopher Helm(1991).
[25] IPCC. 2018. Summary for policymakers. In: Masson-Delmotte V, ZhaiP, Pörtner HO, et al. ( eds.). Global warming of 1.5°C. An IPCC special report on the impacts of global warming of 1.5°C above pre-industrial levels and related global greenhouse gas emission pathways, in the context of strengthening the global response to the threat of climate change, sustainable development, and efforts to eradicate poverty. Geneva, Switzerland: World Meteorological Organization.
[26] JetzW, Wilcove DS, Dobson AP. Projected impacts of climate and land-use change on the global diversity of birds. Plos Biology, 5, 1211-1219(2007).
[27] JnawaliS, BaralH, LeeS et al. The status of Nepal mammals: The national red list series 4. Department of National Parks and Wildlife Conservation Kathmandu. Nepal.(2011).
[28] KarkiM, MoolP, ShresthaA. Climate change and its increasing impacts in Nepal. The Initiation, 3, 30-37(2009).
[29] KaulR, JandrotiaJ, McGowan PJ. Hunting of large mammals and pheasants in the Indian western Himalaya. Oryx, 38, 426-431(2004).
[30] KumarS, RadhakrishnanN, MathewS. Land use change modelling using a Markov model and remote sensing. Geomatics, Natural Hazards and Risk, 5, 145-156(2014).
[31] KumarS, Stohlgren TJ. Maxent modeling for predicting suitable habitat for threatened and endangered tree Canacomyrica monticola in New Caledonia. Journal of Ecology and the Natural Environment, 1, 94-98(2009).
[32] Larson SR, Degroot JP, Bartholomay LC et al. Ecological niche modeling of potential west Nile virus vector mosquito species in Iowa. Journal of Insect Science, 10, 1-17(2010).
[34] LiuL, ZhaoZ, ZhangY et al. Using MaxEnt model to predict suitable habitat changes for key protected species in Koshi basin, central Himalayas. Journal of Resources and Ecology, 8, 77-87(2017).
[35] MaX, GuoJ, YuX. Himalayan Monal (. Lophophorus impejanus): Distribution, habitat and population status in Tibet, China. Chinese Birds, 2, 157-162(2011).
[36] Mandal UK. Geo-information based spatio-temporal modeling of urban land use and land cover change in Butwal municipality, Nepal. International Archives of Photogrammetry, Remote Sensing and Spatial Information Sciences, XL-, 8, 809-815(2014).
[37] MerowC, Smith MJ, Silander JA. A practical guide to MaxEnt for modeling species’ distributions: What it does, and why inputs and settings matter. Ecography, 36, 1058-1069(2013).
[38] Miller JR. Survey of Western Tragopan, Koklass Pheasant, and Himalayan Monal populations in the Great Himalayan National Park, Himachal Pradesh, India. Indian Birds, 6, 60-65(2010).
[39] Mondal MS, SharmaN, GargP et al. Statistical independence test and validation of CA Markov land use land cover (LULC) prediction results. The Egyptian Journal of Remote Sensing and Space Science, 19, 259-272(2016).
[40] Weather summary of Nepal year-2014. Government of Nepal, Ministry of Population and Environment, Department of Hydrology and Meteorology. Kathmandu.(2018).
[41] Mweya CN, Kimera SI, MisinzoG et al. Climate change influences potential distribution of infected Aedes aegypti co-occurrence with dengue epidemics risk areas in Tanzania. Plos One, 11, 1-13(2016).
[42] NieY, ShengY, LiuQ et al. A regional-scale assessment of Himalayan glacial lake changes using satellite observations from 1990 to 2015. Remote Sensing of Environment, 189, 1-13(2017).
[43] Phillips SJ, Anderson RP, Schapire RE. Maximum entropy modeling of species geographic distributions. Ecological Modelling, 190, 231-259(2006).
[44] Phillips SJ, DudíkM, Schapire RE. 2004. A maximum entropy approach to species distribution modeling. In: Proceedings of the twenty-first international conference on Machine learning, ACM, Banff, Canada..
[45] Pielke RA, MarlandG, Betts RA et al. The influence of land-use change and landscape dynamics on the climate system: Relevance to climate-change policy beyond the radiative effect of greenhouse gases. Philosophical Transactions of the Royal Society of London A: Mathematical, Physical and Engineering Sciences, 360, 1705-1719(2002).
[46] RaiR, ZhangY, PaudelB et al. Land use and land cover dynamics and assessing the ecosystem service values in the Trans-Boundary Gandaki River Basin, Central Himalayas. Sustainability, 10, 1-22(2018).
[47] Reddy CS, Pasha SV, SatishK et al. Quantifying nationwide land cover and historical changes in forests of Nepal (1930-2014): Implications on forest fragmentation. Biodiversity and Conservation, 27, 91-107(2018).
[48] RemyaK, RamachandranA, JayakumarS. Predicting the current and future suitable habitat distribution of Myristica dactyloides Gaertn using MaxEnt model in the Eastern Ghats, India. Ecological Engineering, 82, 184-188(2015).
[49] RobertsonT, D?ringM, GuralnickR et al. The GBIF integrated publishing toolkit: Facilitating the efficient publishing of biodiversity data on the internet. Plos One, 9, 1-7(2014).
[50] Segan DB, Murray KA, Watson JE. A global assessment of current and future biodiversity vulnerability to habitat loss-climate change interactions. Global Ecology and Conservation, 5, 12-21(2016).
[51] Sodhi NS, Koh LP, Brook BW et al. Southeast Asian biodiversity: An impending disaster. Trends in Ecology & Evolution, 19, 654-660(2004).
[52] Sodhi NS, Posa M RC, Lee TM et al. The state and conservation of Southeast Asian biodiversity. Biodiversity and Conservation, 19, 317-328(2010).
[53] TeleniusA. Biodiversity information goes public: GBIF at your service. Nordic Journal of Botany, 29, 378-381(2011).
[54] ThuillerW. BIOMOD-Optimizing predictions of species distributions and projecting potential future shifts under global change. Global Change Biology, 9, 1353-1362(2003).
[55] UddinK, Shrestha HL, MurthyM et al. Development of 2010 national land cover database for the Nepal. Journal of Environmental Management, 148, 82-90(2015).
[56] National studybook of Himalayan Monal (Lophophorus impejanus). Wildlife Institute of India, Deharadun and Central Zoo Authority. New Delhi.(2016).
[57] YeB, BaiZ. 2008. Simulating land use/cover changes of Nenjiang County based on CA-Markov model. In: International Conference on Computer and Computing Technologies in Agriculture., Springer, 321-329.
[58] ZhangJ, ZhangY, LiuL et al. Predicting potential distribution of Tibetan spruce (. Picea smithiana) in Qomolangma (Mount Everest) National Nature Preserve using maximum entropy niche-based model. Chinese Geographical Science, 21, 417-426(2011).
[59] ZhaoZ, WuX, ZhangY et al. Assessment of changes in the value of ecosystem services in the Koshi River Basin, central high Himalayas based on land cover changes and the CA-Markov model. Journal of Resources and Ecology, 8, 67-76(2017).


Set citation alerts for the article
Please enter your email address

© Copyright 2018-2021 | Chinese Laser Press. All Rights Reserved 沪ICP备15018463号-20