• Journal of the European Optical Society-Rapid Publications
  • Vol. 18, Issue 2, 2022010 (2022)
Kevin van As1、2, Bram A. Simons1, Chris R. Kleijn1、2, Sasa Kenjeres1、2, and Nandini Bhattacharya3、*
Author Affiliations
  • 1Faculty of Applied Sciences; Department of Chemical Engineering, Delft University of Technology, 2629 HZ, Delft, The Netherlands
  • 2JM Burgerscentrum for Fluid Mechanics, 2628 CD, Delft, The Netherlands
  • 3Faculty of Mechanical, Maritime and Materials Engineering; Department of Precision and Microsystems Engineering, Delft University of Technology, 2628 CD, Delft, The Netherlands
  • show less
    DOI: 10.1051/jeos/2022010 Cite this Article
    Kevin van As, Bram A. Simons, Chris R. Kleijn, Sasa Kenjeres, Nandini Bhattacharya. The dependence of speckle contrast on velocity: a numerical study[J]. Journal of the European Optical Society-Rapid Publications, 2022, 18(2): 2022010 Copy Citation Text show less
    Simulation setup: a plane wave is incident on a cylindrical geometry filled with tiny spherical particles in motion. A “camera”, placed at a right angle, measures the resulting dynamic interferometric speckle pattern over time. Figure not to scale.
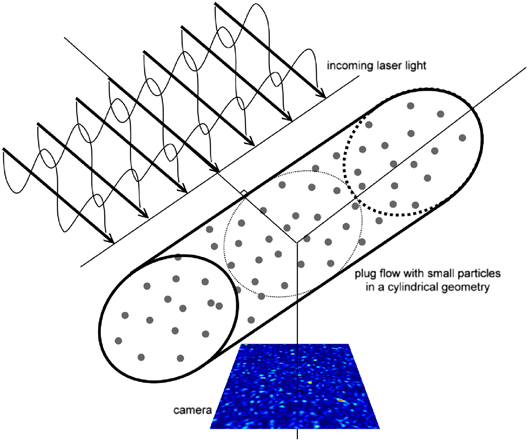
    Fig. 1. Simulation setup: a plane wave is incident on a cylindrical geometry filled with tiny spherical particles in motion. A “camera”, placed at a right angle, measures the resulting dynamic interferometric speckle pattern over time. Figure not to scale.
    Speckle contrast K dependence on scatterer velocity V for various camera integration times T. The error bars show the spread (standard deviation) caused by 10 different sets of random initial particle positions.
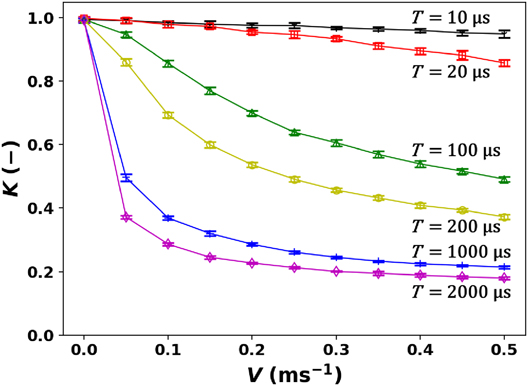
    Fig. 2. Speckle contrast K dependence on scatterer velocity V for various camera integration times T. The error bars show the spread (standard deviation) caused by 10 different sets of random initial particle positions.
    Speckle contrast K dependence on scatterer “distance travelled”, d = VT. The data points are from Figure 2, and are shown to collapse onto a single master curve.
    Fig. 3. Speckle contrast K dependence on scatterer “distance travelled”, d = VT. The data points are from Figure 2, and are shown to collapse onto a single master curve.
    Speckle contrast versus (τc/T)/w = d−1. The data points are the same as in Figure 3. The values of w and β of models (2)–(4) are fit (exception: in the Lorentzian model β = 1 is used), using only the data points with d−1 ≥ 3 × 10⁴.
    Fig. 4. Speckle contrast versus (τc/T)/w = d−1. The data points are the same as in Figure 3. The values of w and β of models (2)(4) are fit (exception: in the Lorentzian model β = 1 is used), using only the data points with d−1 ≥ 3 × 104.
    Speckle contrast versus (τc/T)/w = d−1. The data points are the same as in Figure 3. The value of w of models (2)–(4) are fit, using only the data points with d−1 ≥ 3 × 10⁴, and β = 1 is taken.
    Fig. 5. Speckle contrast versus (τc/T)/w = d−1. The data points are the same as in Figure 3. The value of w of models (2)(4) are fit, using only the data points with d−1 ≥ 3 × 104, and β = 1 is taken.
    Used in Figure 4
    Used in Figure 5
    Modelw (m)β (−)w (β = 1) (m)
    Lorentzian17.5 ± 0.2
    Gaussian12.6 ± 0.20.970 ± 0.00411.8 ± 0.1
    const. vel.23.8 ± 0.30.955 ± 0.00421.8 ± 0.2
    Table 1. Used fit parameters of models (2)(4).
    Kevin van As, Bram A. Simons, Chris R. Kleijn, Sasa Kenjeres, Nandini Bhattacharya. The dependence of speckle contrast on velocity: a numerical study[J]. Journal of the European Optical Society-Rapid Publications, 2022, 18(2): 2022010
    Download Citation