Author Affiliations
1Research and Development Department, Guilin Measuring & Cutting Tool Co., Ltd., Guilin , Guangxi 541004, China2Research and Development Department, Guilin URIT Medical Electronic Co., Ltd., Guilin , Guangxi 541004, Chinashow less
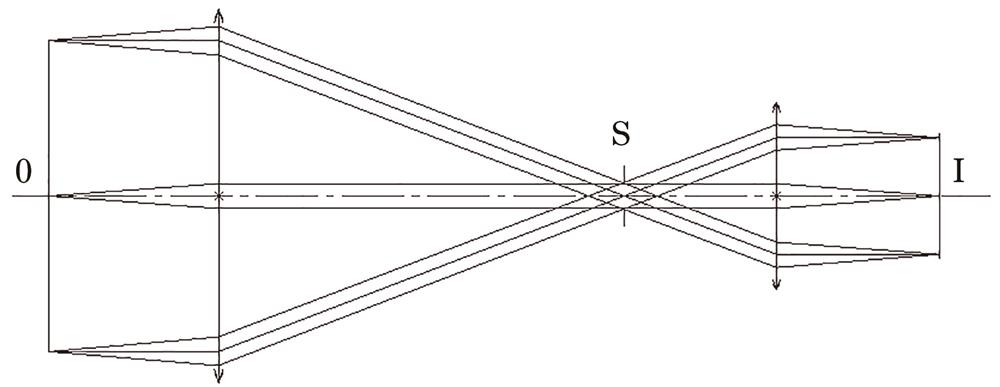
Fig. 1. Sketch map of double-telecentric system
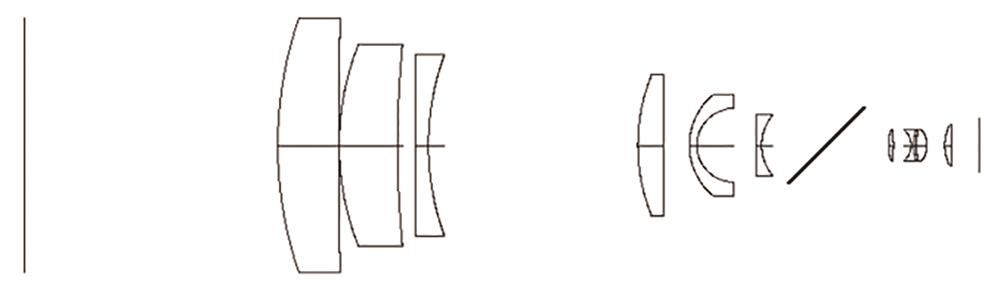
Fig. 2. System initial structural diagram
Fig. 3. Outline drawing of optical system
Fig. 4. Light path diagram of the three-magnification double-telecentric system
Fig. 5. MTF plots. (a)-0.11×; (b)-0.44×; (c)-0.24×
Fig. 6. Spot diagrams. (a)-0.11×; (b)-0.44×; (c)-0.24×
Fig. 7. System distortion when magnification is -0.11. (a) Field curvature /distortion; (b) grid distortion
Fig. 8. System distortion when magnification is -0.44. (a) Field curvature /distortion; (b) grid distortion
Fig. 9. System distortion when magnification is -0.24. (a) Field curvature/distortion; (b) grid distortion
System parameter | Technical index |
---|
Working distance /mm | 110 | F-number | 6 | Field of object /mm | 100, 25, 25 | Magnification | -0.11,-0.24, -0.44 | Field of image /mm | 11,6, 11 | Distortion /% | <0.1 | MTF at 145 lp/mm | >0.3 | Telecentricity /(°) | <0.1 |
|
Table 1. Technical indexes of the telecentric optical system
Magnification | Telecentricity /(°) |
---|
0H | 0.3H | 0.5H | 0.7H | 1H |
---|
-0.11× | 0.0171 | 0.0022 | 0.0125 | 0.0172 | 0.0113 | -0.24× | 0.0038 | 0.0014 | 0.0023 | 0.0029 | 0.0034 | -0.44× | 0.0001 | 0.0017 | 0.0027 | 0.0035 | 0.0042 |
|
Table 2. System telecentricity
Type | Surface | Surface | Value | Criterion | Change |
---|
TIRY | 11 | 11 | -0.012500000 | 0.28336434 | -0.07062743 | TIRX | 11 | 11 | 0.012500000 | 0.29291312 | -0.06107864 | TIRX | 11 | 11 | -0.012500000 | 0.29291312 | -0.06107864 | TIRY | 11 | 11 | 0.012500000 | 0.30447000 | -0.04952176 | TIRY | 12 | 12 | -0.012500000 | 0.31281091 | -0.04118085 | TSDY | 9 | 9 | 0.012500000 | 0.31467464 | -0.03931712 |
|
Table 3. The worst performance when magnification is -0.11
Ratio | >90% | >80% | >50% | >20% | >10% |
---|
MTF at 135 lp/mm | 0.21723603 | 0.22549033 | 0.28938280 | 0.30941017 | 0.32025872 | Max distortion /% | 0.098 | 0.077 | 0.068 | 0.042 | 0.031 |
|
Table 4. MTF and tolerance analysis when magnification is -0.11
Type | Surface | Surface | Value | Criterion | Change |
---|
TIRY | 12 | 12 | -0.012500000 | 0.31327321 | -0.02209004 | TIRY | 12 | 12 | 0.012500000 | 0.31327321 | -0.02209004 | TIRX | 12 | 12 | -0.012500000 | 0.31327321 | -0.02209004 | TIRX | 12 | 12 | 0.012500000 | 0.31327321 | -0.02209004 | TEDX | 11 | 12 | -0.012500000 | 0.31896806 | -0.01639519 | TEDX | 11 | 12 | 0.012500000 | 0.31896806 | -0.01639519 |
|
Table 5. The worst performance when magnification is -0.44
Ratio | >90% | >80% | >50% | >20% | >10% |
---|
MTF at 145 lp/mm | 0.25229633 | 0.27286651 | 0.29586536 | 0.31513817 | 0.31844695 | Max distortion /% | 0.038 | 0.032 | 0.028 | 0.022 | 0.020 |
|
Table 6. MTF and tolerance analysis when magnification is -0.44
Type | Surface | Surface | Value | Criterion | Change |
---|
TEDX | 10 | 11 | -0.02500000 | 0.34125771 | -0.06854529 | TEDX | 10 | 11 | 0.02500000 | 0.34125771 | -0.06854529 | TEDY | 10 | 11 | -0.02500000 | 0.34126254 | -0.06854047 | TEDY | 10 | 11 | 0.02500000 | 0.34126254 | -0.06854047 | TIRX | 11 | 11 | -0.02500000 | 0.35255514 | -0.05724787 | TIRX | 11 | 11 | 0.02500000 | 0.35255514 | -0.05724787 |
|
Table 7. The worst performance when magnification is -0.24
Ratio | >90% | >80% | >50% | >20% | >10% |
---|
MTF at 135 lp/mm | 0.23743036 | 0.26237573 | 0.31907285 | 0.35148023 | 0.36730875 | Max distortion /% | 0.051 | 0.043 | 0.032 | 0.021 | 0.011 |
|
Table 8. MTF and tolerance analysis when magnification is -0.24