
Zaharit Refaeli, Gilad Marcus, Yariv Shamir, "A simple method for pulse contrast enhancement via self-focusing," High Power Laser Sci. Eng. 12, 02000e18 (2024)
- High Power Laser Science and Engineering
- Vol. 12, Issue 2, 02000e18 (2024)
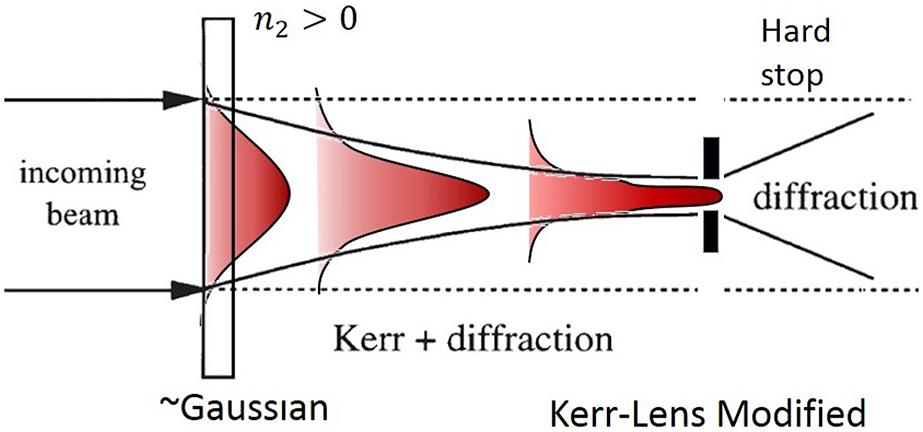
Fig. 1. An Illustration showing the spatial shaping of a Gaussian beam affected by the temporal intensity change, which in turn modifies the medium.
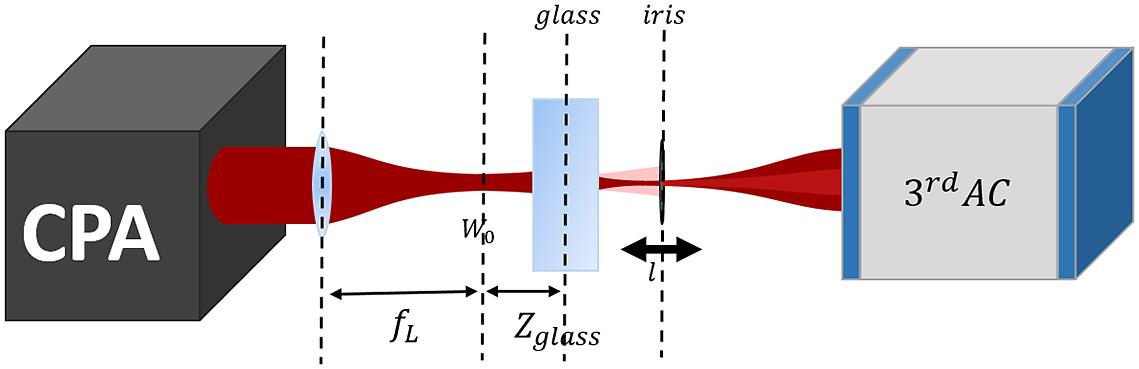
Fig. 2. System schematic.  , linear focal length;
  , beam waist after the lens;
  , glass distance from beam waist;
  , iris-to-glass distance (movable);
  AC, third-order scanning autocorrelator.
, linear focal length; , beam waist after the lens; , glass distance from beam waist; , iris-to-glass distance (movable); AC, third-order scanning autocorrelator. Fig. 3. Illustration of the three KL focusing scenarios, obtained by varying the dielectric location with respect to the beam waist: (a)  , (b)
, (b)  and (c)
  .
.  , linear lens focal length;
  , NL lens focal length. The dark red part represents the peak of the pulse where most of the NL process occurs, whereas the light red part represents lower powers and noises adjacent to the peak with the weaker effect. A crucial parameter that is, to our approach, used as a metric for the contrast change, is the peak-to-noise area ratio at the hard aperture filtration plane. This metric shall be an estimate to the filtering ratio that finally can be related to CE.
, (b) and (c) . , linear lens focal length; , NL lens focal length. The dark red part represents the peak of the pulse where most of the NL process occurs, whereas the light red part represents lower powers and noises adjacent to the peak with the weaker effect. A crucial parameter that is, to our approach, used as a metric for the contrast change, is the peak-to-noise area ratio at the hard aperture filtration plane. This metric shall be an estimate to the filtering ratio that finally can be related to CE. Fig. 4. Peak-to-noise beam area ratios under various iris-to-glass distances ( ) versus
 N values of  and
and  , which were set to 6.3 and 10.7 mm, respectively.
) versus and , which were set to 6.3 and 10.7 mm, respectively. Fig. 5. Two-dimensional plot showing the peak-to-noise area ratio versus l and  . White dashed curve:
  .
.
. White dashed curve: . Fig. 6. Pulse power versus time. Blue, numerically produced contrast trace of power versus time, on a normalized power scale. Orange, a reference  MW power level.
MW power level. Fig. 7. Kerr focal length as a function of glass distance from the beam waist position (blue), crossed with the linear  plot (orange). The intersection point of the two plots represents the precisely collimated case.
plot (orange). The intersection point of the two plots represents the precisely collimated case. Fig. 8. Beam area peak-to-noise ratio  at
at  , where the minimum ratio is obtained at
  = 6.3 mm.
at , where the minimum ratio is obtained at = 6.3 mm. Fig. 9. Kerr focal length as a function of time, based on the numerical pulse from Figure 6 (blue).
Fig. 10. Sum of the 2D generated Gaussians at the iris plane from the top (a) and side views (b). The dashed curve represents the normalized pulse shape assuming no NL effect.
Fig. 11. Spatial Gaussian pulses after experiencing the NL lens projected at the iris plane. The colored curves represent spatial pulses at various times. The (numerical) iris is represented by the black curve.
Fig. 12. Contrast traces before (blue) and after the KL effect and hard aperture filter, for 70 (orange), 34 (green), 10.6 (yellow) and 4.8 μm (purple) aperture diameters, applied upon the numeric Gaussian input beam. Inset: same plots in the time scale of a few ps surrounding the peak, provided for a more detailed observation.
Fig. 13. Measured pulse contrast before (blue) and after the KL effect and the clipping aperture (orange).


Set citation alerts for the article
Please enter your email address

© Copyright 2018-2021 | Chinese Laser Press. All Rights Reserved 沪ICP备15018463号-20