 AI Video Guide
  AI Picture Guide
 AI One Sentence

Zaharit Refaeli, Gilad Marcus, Yariv Shamir, "A simple method for pulse contrast enhancement via self-focusing," High Power Laser Sci. Eng. 12, 02000e18 (2024)
- High Power Laser Science and Engineering
- Vol. 12, Issue 2, 02000e18 (2024)
Note: This section is automatically generated by AI . The website and platform operators shall not be liable for any commercial or legal consequences arising from your use of AI generated content on this website. Please be aware of this.
Abstract
1 Introduction
Since the appearance of high-energy short pulse laser systems based on chirped pulse amplifiers (CPAs)[1], it has become apparent that certain experiments can be hindered by pulse parts that are not confined to the peak vicinity. It is therefore important to define the pulse contrast ratio, that is, the ratio between the peak intensity and intensities extended towards the pulse pedestals. As a result, high-field experiments have made the pulse contrast a property of vast importance. In that context, the most demanding experiments are those involving the interaction of intense light with solids[2,3], as they start to dissociate into plasma. Typically, solid targets experience coulomb explosion under intensities of above
In recent decades, several techniques have been developed to clean up pulses, most of which are based on instantaneous gating mechanisms obtained by nonlinear (NL) processes. Amongst these are, for example, the cross-polarized wave (XPW)[6], second-harmonic generation (SHG)[7], optical parametric amplification (OPA) and, specifically, optical parametric chirped pulse amplification (OPCPA)[8,9,10], plasma mirrors (PMs)[11,12], self-diffraction (SD)[13,14,15], etc. Methods such as those mentioned above typically clean up pulses by two to five orders of magnitude, with reported values of as much as a 70 dB improvement[16]. As with most NL processes, the above-mentioned cases are associated with a significant energy penalty, that is, efficiencies ranging from tens to a few percent.
An exceptional result was introduced in 2020, with an approach based on a spatial NL plasma lens that was generated by an auxiliary pump beam[17]. While achieving contrast enhancement (CE) of two orders of magnitude, with impressive efficiency of approximately 80%, such a method entails significant awkwardness, as it necessitates slaving a secondary laser into the process and accurately synchronizing it with the main laser.
Sign up for High Power Laser Science and Engineering TOC. Get the latest issue of High Power Laser Science and Engineering delivered right to you!Sign up now
The approach described in this work is based on a self-induced single-beam effect, which is achieved by simply activating the basic Kerr lens (KL) effect[18] using peak powers significantly beyond the critical peak power for self-focusing (
Using the KL in the context of pulse cleaning was investigated in a work published in 1975, in the form of a numerical model that simulated the KL mechanism inside a laser oscillator for CE[20]. However, since the model was based on blocking the center of the beam, it predicted optimal operation only inside oscillators, whereas for amplifier applications it is expected to introduce low efficiency. Naturally, under much higher energies such a process is less attractive. This drawback can, in the present context, be offset by certain variations in the model’s scheme, as proposed here. Interestingly, in recent decades, the spatial beam aspect affected by the KL was found to enhance certain laser beam properties. Liu et al.[21] demonstrated spatial cleanup, namely M2 beam parameter reduction via the KL, induced by a short pulse in a multi-mode graded-index fiber. Against most of the CE efforts, intentional reduction of the pulse contrast via the KL effect was demonstrated in 2019[22] with the purpose of measuring high pulse contrast with limited diagnostics. The current study follows an alternative path to the latter, which with some further modification, can achieve pulse CE.
In 2021, an experimental study on the KL effect on CE demonstrated the use of multiple plates and a succeeding filter[23]. This study indeed confirmed the validity of the self-focusing approach for CE. The work presented here proposes a complementary approach, providing both a numerical model and a validation with a single-stage NL element.
2 Kerr lens approach
Here, we propose a method that uses the KL to discriminate between different time-varying pulse intensity levels. In a simplified description, the technique is aimed to improve contrast via gently controlled KL excitation in a relatively thin dielectric, that is, the beam experiences negligible transverse variations while traversing a short path along the dielectric. However, it induces angular convergence, as elaborated below. The method’s principle is of translating the time-varying pulse intensity profile to corresponding variations in its spatial dimensions, that is, the beam waist size, and then consecutively applying spatial filtration. The latter spatially modifies parts that traverse the filter, which, in turn, affects its temporal profile.
It is to be stressed that as a byproduct, the process potentially involves excitation of the NL phase via self-phase modulation (SPM), adding some B-integrals as well as positive second-order dispersion to the pulse phase. This implies that in the case in which obtaining the shortest available pulse from the setup is mandatory, some extra dispersion compensation may be required.
The numerical model’s concept maintains two assumptions. Firstly, the KL is induced within a relatively thin dielectric (‘thin’ refers here to negligible beam diameter variations while traversing through the dielectric), that is, the beam only obtains a local angular bend and starts to converge. Naturally, the physical process involves the combination of angular change and some diameter change. The propagation stage where the waist is formatted occurs outside the sample, (i.e., in air or vacuum). As a byproduct, there is a lower risk of further NL accumulation or material breakdown (air ionization starts at I
Assuming sufficient pulse intensity is available, the underlying mechanism can be described as follows. Initially, low-intensity pulse parts that are temporally far from the main peak nearly maintain their spatial properties as they merely experience any Kerr nonlinearity. As a result, the beam divergence remains practically unchanged when passing the dielectric. In contrast, higher-intensity parts, including the main peak, maintain enough energy to excite the KL, which in turn modifies the beam’s angular propagation and, consequently, its diameter. The process is to be kept under gentle control, that is, such that it is far enough from initiating aggressive focusing and material breakdown. Next, a spatial filter is applied such as, for example, an iris/hard aperture, to filter a portion of the Gaussian beam’s exterior, as shown in Figure 1.
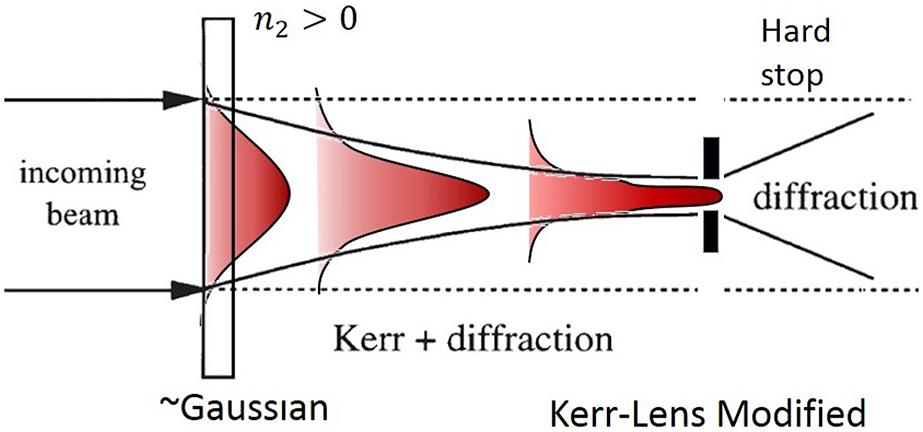
Figure 1.An Illustration showing the spatial shaping of a Gaussian beam affected by the temporal intensity change, which in turn modifies the medium.
On the downside, one can list the inevitable addition of the B-integral to the pulse phase, potentially adding some temporal phase structure that temporally broadens the incident pulse by a slight up-chirp. The NL B-integral phase addition can be readily estimated via[25]
It is again pointed out that the assumed applied power level does not lead to total beam collapse and optics damage. Practically, this can be handled by avoiding two distinct criteria: intensities of
As a last remark, it is reasonable to argue that the suggested method has several potential distinct benefits over the well-known methods due to its ease of implementation, very low-cost components and not requiring the temporal and spatial synchronization of the beams.
3 System schematics
The experimental scheme that exploits the temporal-spatial pulse coupling is presented in Figure 2.
![]()
Figure 2.System schematic.  , linear focal length;
  , beam waist after the lens;
  , glass distance from beam waist;
  , iris-to-glass distance (movable);
  AC, third-order scanning autocorrelator.
We assume a collimated near-infrared ultrashort pulse with available peak power significantly beyond the dielectric’s NL critical power. In the first stage, the beam is focused by a lens with a (linear) focal length
Focusing the beam in the first stage is needed for initiating the NL mechanism, especially in the case of fairly low pulse energies. Furthermore, as shown below,
Next, while the beam enters the NL medium, a new converging beam trajectory is induced by the Kerr effect, whose focal length can be calculated (assuming Gaussian intensity shape) by the following equation[
- (1)the NL dielectric is located at
${z}_{\mathrm{glass}}={f}_{\mathrm{NL}}$ - (2)the NL dielectric is located at
${z}_{\mathrm{glass}}<{f}_{\mathrm{NL}}$ - (3)the NL dielectric is located at
${z}_{\mathrm{glass}}>{f}_{\mathrm{NL}}$
![]()
Figure 3.Illustration of the three KL focusing scenarios, obtained by varying the dielectric location with respect to the beam waist: (a)  , (b)
, (b)  and (c)
  .
.  , linear lens focal length;
  , NL lens focal length. The dark red part represents the peak of the pulse where most of the NL process occurs, whereas the light red part represents lower powers and noises adjacent to the peak with the weaker effect. A crucial parameter that is, to our approach, used as a metric for the contrast change, is the peak-to-noise area ratio at the hard aperture filtration plane. This metric shall be an estimate to the filtering ratio that finally can be related to CE.
The temporal cleaning method provided in this study is based on spatial separation, practically achieved via the presence of an aperture. Looking at the three scenarios illustrated in Figure 3, it is argued that the highest area ratio between the peak (dark red) and the noise (light red) is obtained in case (3), and at the tightest NL focus. The area ratio is as follows:
As obtained from Figure 4, for a given
![]()
Figure 4.Peak-to-noise beam area ratios under various iris-to-glass distances ( ) versus
  and
and  , which were set to 6.3 and 10.7 mm, respectively.
By inserting the explicit expressions
Sign up for High Power Laser Science and Engineering TOC. Get the latest issue of High Power Laser Science and Engineering delivered right to you!Sign up now
Obviously, one may seek a case where the smallest
![]()
Figure 5.Two-dimensional plot showing the peak-to-noise area ratio versus  . White dashed curve:
  .
.
In addition, the location of the newly formed waist at the pulse peak (
The expression in Equation (4) is represented by the white dashed curve in Figure 5. It can be seen that the white line is located exactly on the minimum of
Given the latter outcome, the hard aperture iris was selected to be positioned at the very spot where the KL-induced waist position occurs:
Sign up for High Power Laser Science and Engineering TOC. Get the latest issue of High Power Laser Science and Engineering delivered right to you!Sign up now
It is worth noting that in order to apply the model’s initial assumption for thin glasses,
In another aspect, the iris aperture size constitutes a trade-off between efficiency and CE, since a larger aperture transmits more energy whereas a smaller aperture increases CE.
At low intensities, the iris blocks the majority of the emerging beam as its diameter (and area) is smaller relative to the pulse beam area at this position. In contrast, near the intensity peak, the majority of the beam energy is confined to the NL waist
4 Numerical model
In this section, a numerical model with parameters resembling those of the available laser system was established to evaluate the expected CE.
Temporal and spatial Gaussian shapes were assumed. Next, some temporal noise features were artificially added to the pulse vicinity in order to represent non-ideal contrast. The noise levels are specified below. The time profile included, firstly, a sharp peak of a few hundred fs duration that is typical for Yb-doped glass amplifiers, accompanied by a time-exponential coherent pedestal (CP) that is typically reported to surround the peak vicinity by several 10 ps. While presented on a power scale, the CP has a linear skirt-like shape (Figure 6). A lower noise pedestal was also introduced to represent the longer-term amplified spontaneous emission (ASE) noise in the amplifiers. This noise level typically spans multi-hundred ps from both sides of the peak.
![]()
Figure 6.Pulse power versus time. Blue, numerically produced contrast trace of power versus time, on a normalized power scale. Orange, a reference  MW power level.
In recent decades, studies have pointed out that the CP is attributed mainly to grating irregularities and scattering found, for example, on the groove edges[30], as well as imperfections in the (whole) stretcher and compressor structures.
Based on reports[
The parameters that were used in the numerical model are as follows: pulse energy E = 1 mJ, central wavelength CWL = 1053 nm, divergence angle
In order to determine the appropriate
The resulting NL focal length as a function of
![]()
Figure 7.Kerr focal length as a function of glass distance from the beam waist position (blue), crossed with the linear  plot (orange). The intersection point of the two plots represents the precisely collimated case.
To obtain the optimal beam areas ratio, it is beneficial to follow the
![]()
Figure 8.Beam area peak-to-noise ratio  at
at  , where the minimum ratio is obtained at
  = 6.3 mm.
Since in real scenarios it is not always possible to work at extremely short distances, or extremely small apertures, a slightly larger z can be chosen in order to shift the NL focal position, or enlarge the NL focal size.
In what follows, calculation of the NL focal length versus time is provided, where Equation (1) is applied with the optimal
![]()
Figure 9.Kerr focal length as a function of time, based on the numerical pulse from
In order to estimate the spatial filtration effect, the NL beam waist diameter was calculated as well as the NL-induced waist position (with respect to the NL dielectric) according to the Gaussian beam propagation equation[
The calculated position of the new waist at the peak (t = 0) was
Next, the instantaneous beam radii, obtained at the iris plane, were calculated using the following equation:
Following the calculated waists
The sum of all time frames at the iris plane is represented in Figure 10. As can be seen, the final shape resembles a Gaussian one, albeit with a somewhat sharper center.
![]()
Figure 10.Sum of the 2D generated Gaussians at the iris plane from the top (a) and side views (b). The dashed curve represents the normalized pulse shape assuming no NL effect.
In order to simulate the hard aperture spatial effect, a 2D circle with varying radii was (numerically) spatially multiplied by the 2D beam shape, in different pulse times. Figure 11 represents this projection on the x-axis at different times (colorful plots), while the iris itself is represented by the black rectangle. As can be observed, the spatial pulse generated at t = 0 (Figure 11 in yellow) practically completely traverses the aperture, whereas the spatial pulse preceding the peak by t = –61.6 ps (Figure 11 in purple) or earlier suffers a considerable blocking.
![]()
Figure 11.Spatial Gaussian pulses after experiencing the NL lens projected at the iris plane. The colored curves represent spatial pulses at various times. The (numerical) iris is represented by the black curve.
5 Results
A two-stage computation was carried out in order to produce the temporal pulse profile following the spatial filtration. The iris aperture and the pulse beam shape were first spatially multiplied, and then the beam’s spatial domain was integrated,
![]()
Figure 12.Contrast traces before (blue) and after the KL effect and hard aperture filter, for 70 (orange), 34 (green), 10.6 (yellow) and 4.8 μm (purple) aperture diameters, applied upon the numeric Gaussian input beam. Inset: same plots in the time scale of a few ps surrounding the peak, provided for a more detailed observation.
In addition, in order to complete the performance estimation, the whole process’s efficiency was calculated by extracting the ratio of the transmitted energy to the incident energy, using the following integration:
The aforementioned integration was carried out using a variety of aperture radii, considered in ascending order, from largest to smallest, associated with highest-to-lowest transmission, respectively.
For aperture diameters of 70, 34, 10.6 and 4.8 μm, the obtained CE factors were 5, 10, 20 and 25 dB, with corresponding efficiencies of 90%, 74%, 44% and 23% (within the FWHM pulse range) (Figure 12). Considering different energy integration criteria, for example, 10% power drop yields somewhat different efficiencies, 82%, 64%, 36% and 19%, for the same iris diameters, respectively. Of course, as the application demands, various energy integration criteria can be set.
It is, however, stressed that the peak vicinity has a pronounced effect on the experiment, and thus a longer time consideration can be of a lesser value.
It is worth mentioning that according to the simulation results, it can be concluded that a need for small apertures may be impractical. A simple way around this obstacle is applying a magnification (e.g., an imaging stage), allowing the use of larger apertures in a real experiment.
Next, an experimental setup was set in order to validate the applicability of the above model. A full description of the experimental system can be found in Section 3.
The laser setup parameters are as follows: a Yb fiber CPA with a center wavelength of
A baseline reference contrast was set as the raw unfiltered CPA pulses, which is needed to be compared with respect to pulses that experienced the NL effect, as proposed in the model. For evaluating the results, a third-order scanning autocorrelator (AC) was used (Ultrafast-Innovations ‘Tundra’) with optical hardware dedicated to the 1 μm vicinity[34].
According to the experimental results that are plotted in Figure 13, the original laser pulses yielded contrast values of around
![]()
Figure 13.Measured pulse contrast before (blue) and after the KL effect and the clipping aperture (orange).
As for the NL phase induced by the setup, the given parameters yield approximately 1 radian, which hardly disrupts the time pulse shape and therefore its contrast as well.
It should be noted that in the experiment, lower pulse energies and therefore thicker glasses were applied, with reference to the model’s example. It is to be stressed out that at this early stage of the study, the model refers to a simplified mechanism in which intra-glass beam variations were negligible. In a succeeding work, a more mature model shall cover more complexities, including the processes accumulated within the glass. Such progress shall enable one to validate the experiment more accurately. In addition, an energy upgrade of the scheme shall enable one to operate with thinner glasses and meet cases more overlapping with the numerical model.
6 Conclusions
To conclude, a cost-effective concept for CE based on the KL is proposed. Its attractiveness is based mainly on its simplicity and small number of components, basically an NL glass piece followed by a hard aperture. By correctly placing the components in accordance with specific pulse parameters, the effect can be enhanced. An underlying theoretical and numerical description was provided and expressed via formulas and numerical support. The method is based on the temporal dependence of the NL effect. This dependence is transformed into a spatial one, which is manifested back to provide a cleaner time profile. While a new spatial beam waist is created at the time-peak of the pulse (under certain conditions of
References
[1] P. Maine, D. Strickland, P. Bado, M. Pessot, G. Mourou. IEEE J. Quantum Electron., 24, 398(1988).
[2] M. M. Murnane, H. C. Kapteyn, R. W. Falcone. Phys. Rev. Lett., 62, 155(1989).
[3] D. Neely, P. Foster, A. Robinson, F. Lindau, O. Lundh, A. Persson, C.-G. Wahlström, P. McKenna. Appl. Phys. Lett., 89, 021502(2006).
[4] J. P. Singh, S. N. Thakur. Laser-induced Breakdown Spectroscopy, 4148(2020).
[5] P. Sharma, R. K. Vatsa. Materials under Extreme Conditions, 575(2017).
[7] L. Shen, Y. Li, W. Li, J. Song, J. Qian, J. Sun, R. Feng, Y. Peng, Y. Leng. High Power Laser Sci. Eng., 11, e1(2023).
[8] J. Ma, P. Yuan, Y. Wang, H. Zhu, L. Qian. Opt. Commun., 285, 4531(2012).
[9] Z. Wang, C. Liu, Z. Shen, Q. Zhang, H. Teng, Z. Wei. Opt. Lett., 36, 3194(2011).
[10] Y. Huang, C. Zhang, Y. Xu, D. Li, Y. Leng, R. Li, Z. Xu. Opt. Lett., 36, 781(2011).
[11] G. Doumy, F. Quéré, O. Gobert, M. Perdrix, P. Martin, P. Audebert, J. C. Gauthier, J. P. Geindre, T. Wittmann. Phys. Rev. E, 69, 026402(2004).
[12] M. P. Kalashnikov, E. Risse, H. Schönnagel, W. Sandner. Opt. Lett., 30, 923(2005).
[13] J. Liu, K. Okamura, Y. Kida, T. Kobayashi. Opt. Express, 18, 22245(2010).
[14] X. Z. Wang, Z. H. Wang, Y. Y. Wang, X. Zhang, J. J. Song, Z. Y. Wei. Chin. Phys. Lett., 38, 074202(2021).
[15] X. Shen, P. Wang, J. Liu, R. Li. High Power Laser Sci. Eng., 6, e23(2018).
[16] N. Xie, X. Huang, X. Wang, K. Zhou, L. Sun, Y. Guo, J. Su. J. Mod. Opt., 67, 1314(2020).
[17] P. Zhu, A. Zigler, X. Xie, D. Zhang, Q. Yang, M. Sun, J. Papeer, J. Kang, Q. Gao, X. Liang, H. Zhu, A. Guo, Y. Liang, S. Ji, L. Ren, H. Liu, N. Kang, Y. Zhao, J. Zhu. Opt. Lett., 45, 2279(2020).
[18] P. L. Kelley. Phys. Rev. Lett., 15, 1005(1965).
[19] A. L. Gaeta. Phys. Rev. Lett., 84, 3582(2000).
[20] E. G. Lariontsev, V. N. Serkin. Soviet J. Quantum Electron., 5, 796(1975).
[21] Z. Liu, L. G. Wright, D. N. Christodoulides, F. W. Wise. Opt. Lett., 41, 3675(2016).
[22] X. Shen, P. Wang, J. Zhu, Z. Si, Y. Zhao, J. Liu, R. Li. Opt. Express, 27, 10586(2019).
[23] X. Lu, Y. Leng. Opt. Lett., 46, 5108(2021).
[24] A. Weiner. Ultrafast Optics, 57(2011).
[25] M. J. Weber, D. Milam, W. L. Smith. Opt. Eng., 17, 463(1978).
[26] F. Verluise, V. Laude, Z. Cheng, C. Spielmann, P. Tournois. Opt. Lett., 25, 575(2000).
[27] A. Bendib, K. Bendib-Kalache, C. Deutsch. Laser Particle Beams, 31, 523(2013).
[28] J. H. Marburger. Prog. Quantum Electron., 4, 35(1975).
[30] C. Hooker, Y. Tang, O. Chekhlov, J. Collier, E. Divall, K. Ertel, S. Hawkes, B. Parry, P. P. Rajeev. Opt. Express, 19, 2193(2011).
[31] C. Danson, D. Neely, D. Hillier. High Power Laser Sci. Eng., 2, e34(2014).
[32] J. Buldt, M. Mueller, R. Klas, T. Eidam, J. Limpert, A. Tünnermann. Advanced Solid State Lasers(2017).
[33] S. A. Self. Appl. Opt., 22, 658(1983).
[34] www.ultrafast-innovations.com. www.ultrafast-innovations.com
[35] P. A. Bélanger. Opt. Lett., 16, 196(1991).


Set citation alerts for the article
Please enter your email address

© Copyright 2018-2021 | Chinese Laser Press. All Rights Reserved 沪ICP备15018463号-20