
Wei Zhang, Chunyang Niu, Xinghai You, Bo Yuan, Liqiang Wang, Qing Yang. Endocytoscopic Imaging System with High Magnification and Large Field of View[J]. Acta Optica Sinica, 2021, 41(17): 1717001
- Acta Optica Sinica
- Vol. 41, Issue 17, 1717001 (2021)
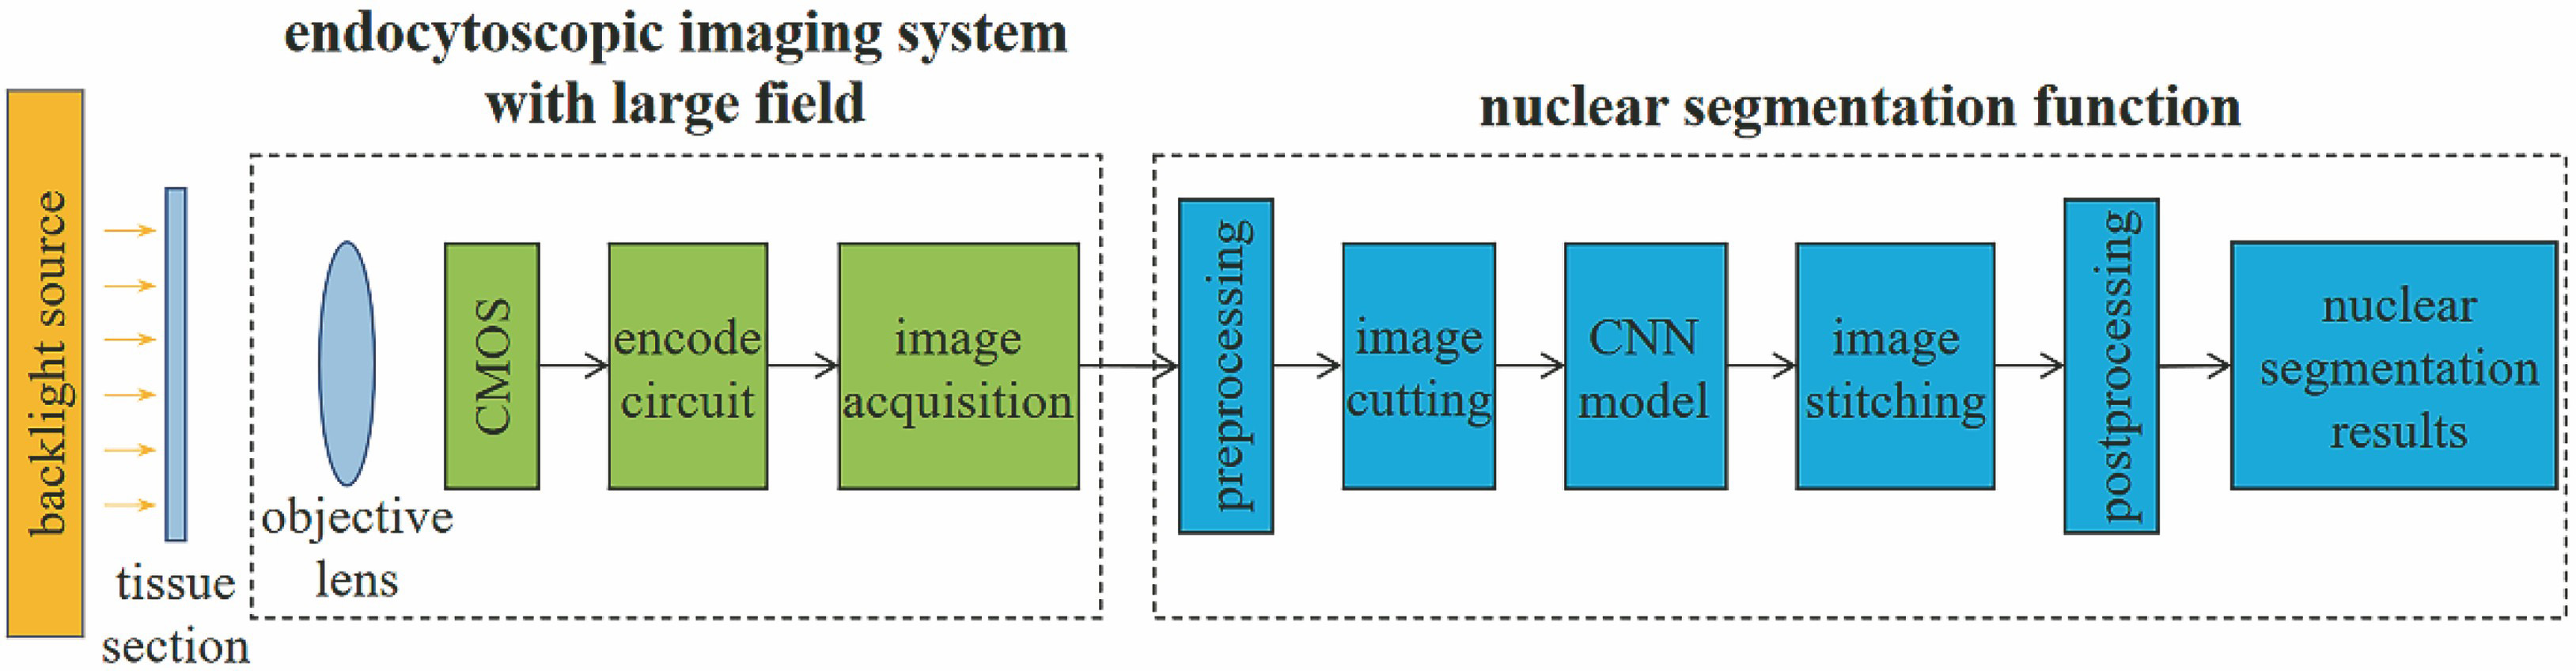
Fig. 1. Structure of large-view field endocytoscopic imaging system with nuclear segmentation function
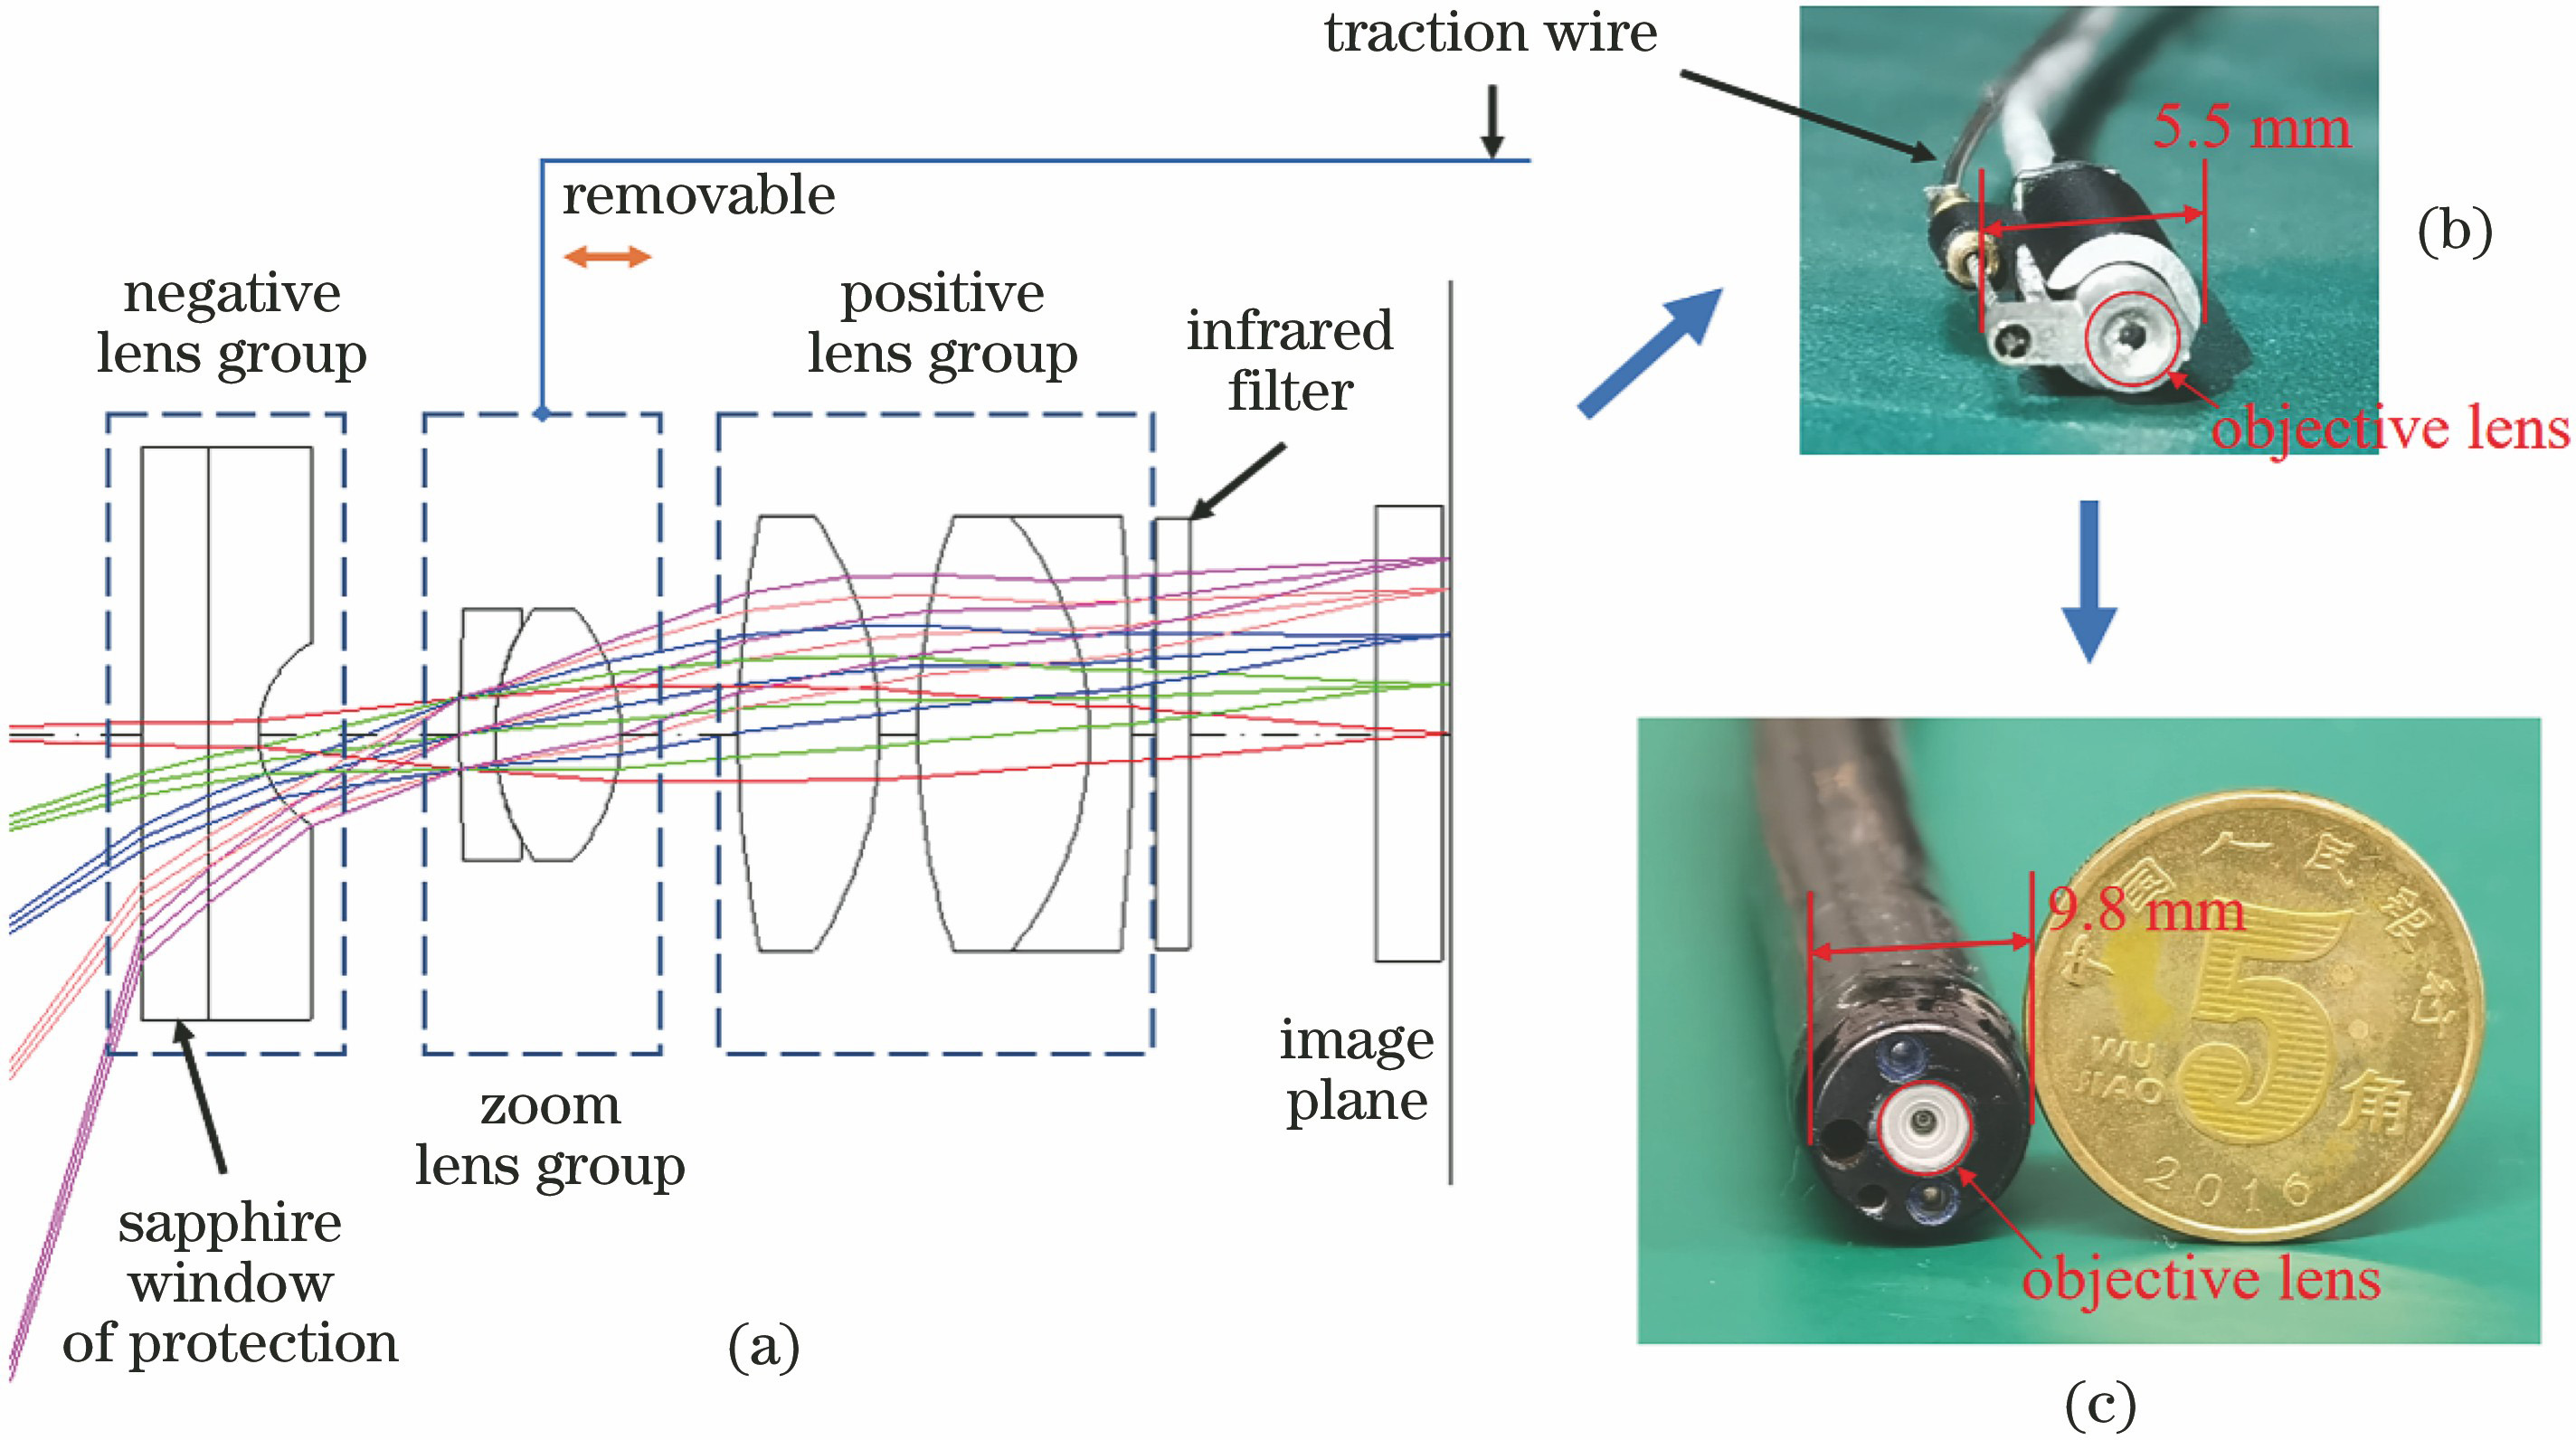
Fig. 2. Design and assembly of zoom endoscopic objective lens with large-view field. (a) Optical structure; (b) endocytoscopic imaging module; (c) endocytoscopic tip
Fig. 3. Modulation transfer function (MIF) of two imaging modes of zoom endoscopic objective lens with large-view field. (a) Conventional imaging mode; (b) magnifying imaging mode
Fig. 4. Spot diagrams of two imaging modes of zoom endoscopic objective lens with large-view field. (a) Conventional imaging mode; (b) magnifying imaging mode
Fig. 5. Imaging performance experimental system
Fig. 6. Images of resolution target captured by endocytoscopic imaging system with large-view field. (a) Conventional imaging; (b) micro-imaging
Fig. 7. Comparison of photos captured by endocytoscopic imaging system with large-view field and digital pathology section scanner. (a) Photo captured by endocytoscopic imaging system with large-view field; (b) photo captured by digital pathology section scanner
Fig. 8. Training and inference procedures of U-Net nuclear segmentation model
Fig. 9. Structure of U-Net nuclear segmentation model
Fig. 10. Nuclear segmentation results of U-Net model. (a)(c)(e) Original images; (b)(d)(f) segmentation results
|
Table 1. Design requirements of zoom endoscopic objective lens with large-view field
|
Table 2. Comparison of parameters of endocytoscopic imaging systems
|
Table 3. Segmentation of U-Net nuclear segmentation model on the test images

Set citation alerts for the article
Please enter your email address
© Copyright 2018-2021 | Chinese Laser Press. All Rights Reserved 沪ICP备15018463号-20