• Spectroscopy and Spectral Analysis
  • Vol. 41, Issue 1, 116 (2021)
Shuai CHEN1、1, Xu-yang WANG1、1, Fei LI1、1, and Jun-sheng YUAN1、1
Author Affiliations
  • 1[in Chinese]
  • 11. School of Chemical Engineering, Hebei University of Technology, Tianjin 300130, China
  • show less
    DOI: 10.3964/j.issn.1000-0593(2021)01-0116-06 Cite this Article
    Shuai CHEN, Xu-yang WANG, Fei LI, Jun-sheng YUAN. Study of Raman Spectroscopy on the Structure of NH4Cl Aqueous Solution Under Strong Magnetic Field[J]. Spectroscopy and Spectral Analysis, 2021, 41(1): 116 Copy Citation Text show less
    Schematic diagram of the magnetic field device
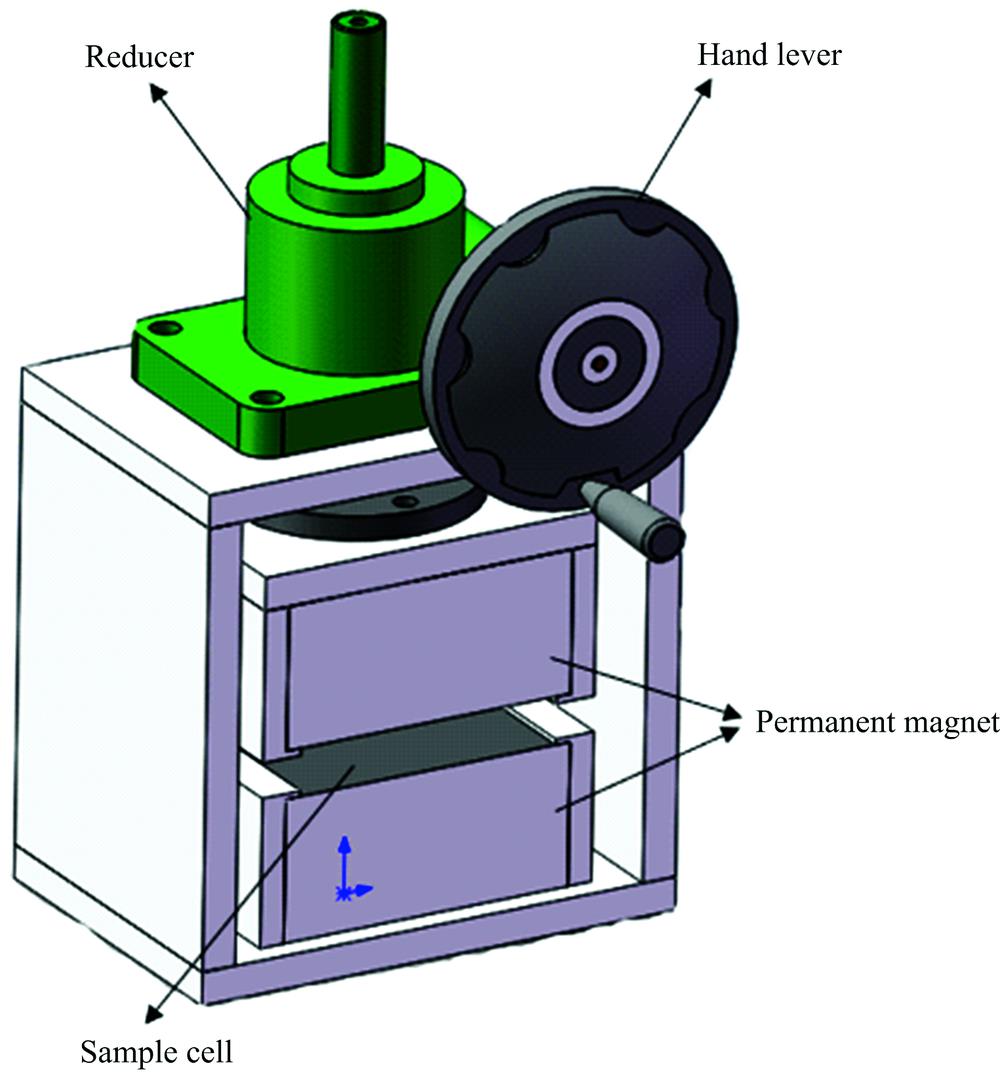
    Fig. 1. Schematic diagram of the magnetic field device
    (a) Raman spectra of high-purity water magnetized at different time; (b) Raman spectra of 5% NH4Cl aqueous solution magnetized at different time; (c) Raman spectra of 28% NH4Cl aqueous solution magnetized at different time; (d) magnetization saturation time of NH4Cl aqueous solution with different mass percentages
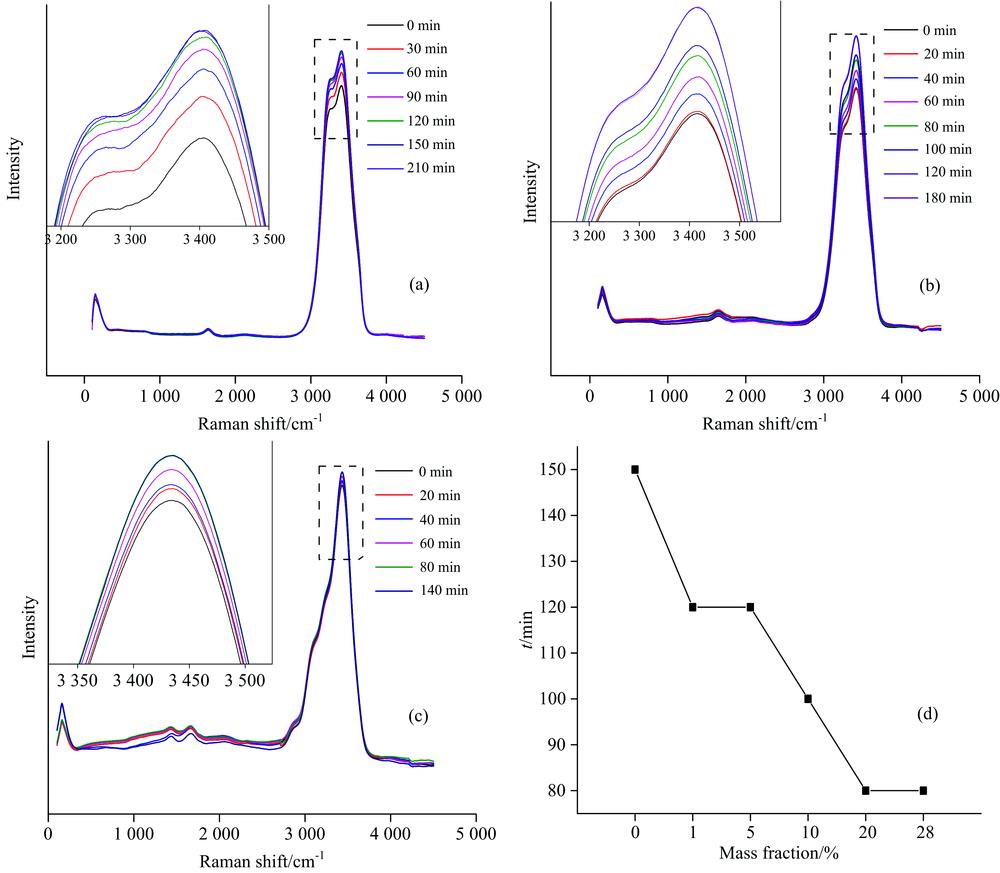
    Fig. 2. (a) Raman spectra of high-purity water magnetized at different time; (b) Raman spectra of 5% NH4Cl aqueous solution magnetized at different time; (c) Raman spectra of 28% NH4Cl aqueous solution magnetized at different time; (d) magnetization saturation time of NH4Cl aqueous solution with different mass percentages
    (a) Raman spectra of high-purity water at different time after the magnetic field is removed; (b) Raman spectra of 5% NH4Cl aqueous solution at different time after the magnetic field is removed; (c) Raman spectra of 28% NH4Cl aqueous solution at different times after the magnetic field is removed; (d) demagnetization memory time of NH4Cl aqueous solution with different mass percentages
    Fig. 3. (a) Raman spectra of high-purity water at different time after the magnetic field is removed; (b) Raman spectra of 5% NH4Cl aqueous solution at different time after the magnetic field is removed; (c) Raman spectra of 28% NH4Cl aqueous solution at different times after the magnetic field is removed; (d) demagnetization memory time of NH4Cl aqueous solution with different mass percentages
    (a) deconvolution fitting result of Raman spectra of 10% NH4Cl aqueous solution after 2 h magnetization; (b) deconvolution fitting result of Raman spectra of 20% NH4Cl aqueous solution after 2 h magnetization
    Fig. 4. (a) deconvolution fitting result of Raman spectra of 10% NH4Cl aqueous solution after 2 h magnetization; (b) deconvolution fitting result of Raman spectra of 20% NH4Cl aqueous solution after 2 h magnetization
    DDAA+DA area radio variation diagram of NH4Cl aqueous solution with different mass percentages after 2 h magnetization
    Fig. 5. DDAA+DA area radio variation diagram of NH4Cl aqueous solution with different mass percentages after 2 h magnetization
    Composition
    (mass fraction)
    Concentration
    /(mol·L-1)
    Density
    /(g·cm-3)
    Molar ratio
    (H2O:NH4Cl)
    1%0.184 30.985 92:587
    5%0.945 51.011 510:563
    10%1.920 01.027 020:534
    20%3.949 61.056 350:593
    28%5.607 91.071 370:534
    Table 1. Physical parameters of NH4Cl aqueous solution
    Shuai CHEN, Xu-yang WANG, Fei LI, Jun-sheng YUAN. Study of Raman Spectroscopy on the Structure of NH4Cl Aqueous Solution Under Strong Magnetic Field[J]. Spectroscopy and Spectral Analysis, 2021, 41(1): 116
    Download Citation