• Chinese Optics Letters
  • Vol. 19, Issue 10, 103801 (2021)
Yangwu Li, Hua Lu*, Jiadeng Zheng, Shichang Li, Xiao Xuan, and Jianlin Zhao**
Author Affiliations
  • MOE Key Laboratory of Material Physics and Chemistry under Extraordinary Conditions, Key Laboratory of Light-Field Manipulation and Information Acquisition, Ministry of Industry and Information Technology, and Shaanxi Key Laboratory of Optical Information Technology, School of Physical Science and Technology, Northwestern Polytechnical University, Xi’an 710129, China
  • show less
    DOI: 10.3788/COL202119.103801 Cite this Article Set citation alerts
    Yangwu Li, Hua Lu, Jiadeng Zheng, Shichang Li, Xiao Xuan, Jianlin Zhao. Perfect light absorption in monolayer MoS2 empowered by optical Tamm states[J]. Chinese Optics Letters, 2021, 19(10): 103801 Copy Citation Text show less
    Schematic diagram of the multilayer structure consisting of two different Bragg mirrors and a monolayer MoS2 sandwiched in the Bragg mirrors. The thicknesses of Si3N4 and SiO2 layers are denoted by al and bl (ar and br) for the left (right) Bragg mirror, respectively. The period numbers of the left and right Bragg mirrors are Pl and Pr, respectively. The light is incident from the left side of the structure.
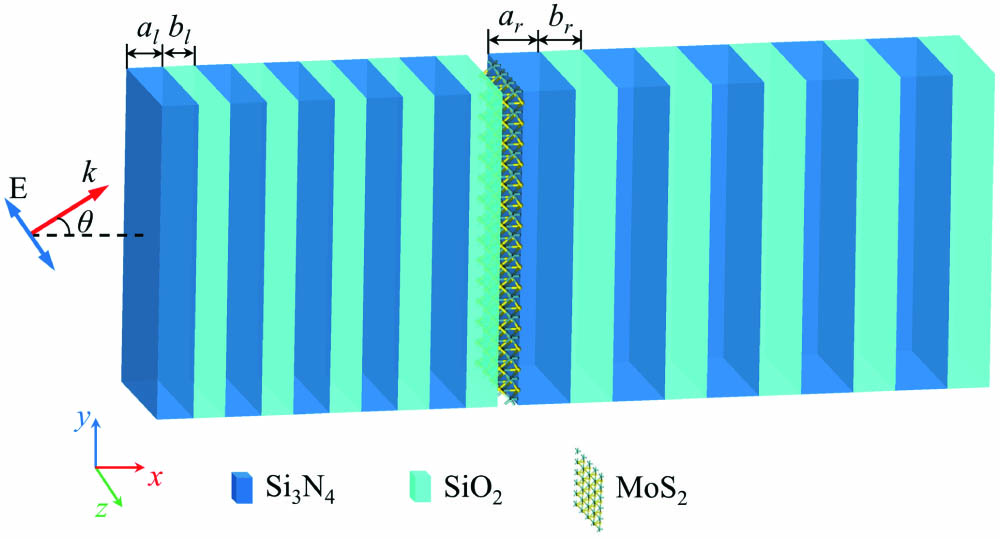
    Fig. 1. Schematic diagram of the multilayer structure consisting of two different Bragg mirrors and a monolayer MoS2 sandwiched in the Bragg mirrors. The thicknesses of Si3N4 and SiO2 layers are denoted by al and bl (ar and br) for the left (right) Bragg mirror, respectively. The period numbers of the left and right Bragg mirrors are Pl and Pr, respectively. The light is incident from the left side of the structure.
    (a) Reflection spectra in the multilayer structure with Pl = 8, Pr = 20, al = 89 nm, bl = 44 nm, ar = 148 nm, br = 130 nm, and θ = 0°. (b) Light absorption spectra of the multilayer structure with a MoS2 monolayer. The lines and circles represent theoretical and simulation results, respectively. The upper inset shows the field distribution of |E|2 at the wavelength of 509.5 nm in the multilayer structure (h = 0 nm). The lower inset shows the spectrum of MoS2 light absorption in the full visible range.
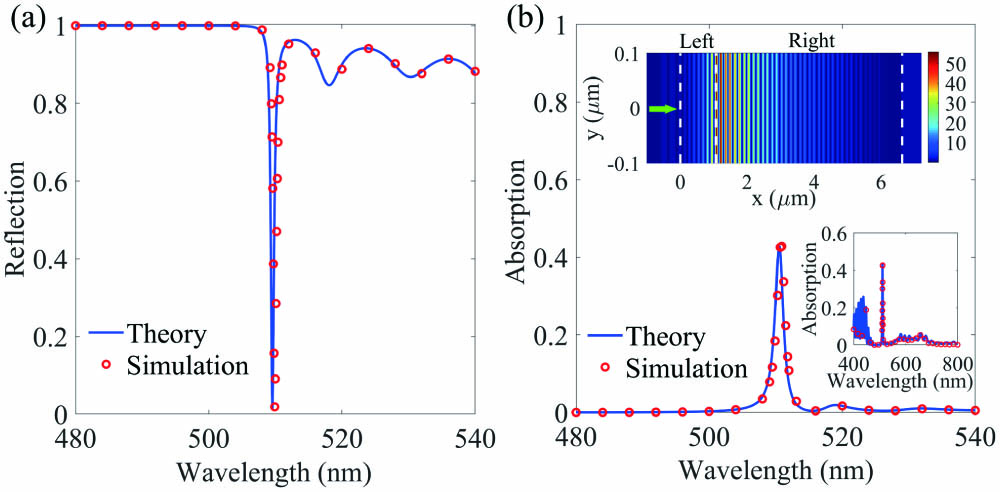
    Fig. 2. (a) Reflection spectra in the multilayer structure with Pl = 8, Pr = 20, al = 89 nm, bl = 44 nm, ar = 148 nm, br = 130 nm, and θ = 0°. (b) Light absorption spectra of the multilayer structure with a MoS2 monolayer. The lines and circles represent theoretical and simulation results, respectively. The upper inset shows the field distribution of |E|2 at the wavelength of 509.5 nm in the multilayer structure (h = 0 nm). The lower inset shows the spectrum of MoS2 light absorption in the full visible range.
    (a) Evolution of MoS2 light absorption spectrum with the Si3N4 layer thickness al in the structure with ar = 148 nm and θ = 0°. (b) Corresponding absorption spectrum of MoS2 monolayer when al = 82 nm and θ = 0°. The inset shows the dependence of electric field intensity in MoS2 on al. (c) Evolution of MoS2 light absorption spectrum with the thickness ar when al = 82 nm and θ = 0°. (d) Evolution of MoS2 light absorption spectrum with θ when al = 82 nm and ar = 149 nm. The circles denote the simulation results. Here, Pl = 8, Pr = 20, bl = 44 nm, and br = 130 nm.
    Fig. 3. (a) Evolution of MoS2 light absorption spectrum with the Si3N4 layer thickness al in the structure with ar = 148 nm and θ = 0°. (b) Corresponding absorption spectrum of MoS2 monolayer when al = 82 nm and θ = 0°. The inset shows the dependence of electric field intensity in MoS2 on al. (c) Evolution of MoS2 light absorption spectrum with the thickness ar when al = 82 nm and θ = 0°. (d) Evolution of MoS2 light absorption spectrum with θ when al = 82 nm and ar = 149 nm. The circles denote the simulation results. Here, Pl = 8, Pr = 20, bl = 44 nm, and br = 130 nm.
    (a) Light absorption spectra of MoS2 monolayer in the multilayer structure with different period numbers Pl when Pr = 20. (b) Absorption peak values of MoS2 as a function of Pl, and the wavelengths of MoS2 absorption peak and OTS as a function of Pl. (c) Absorption spectra of MoS2 obtained by the TMM calculation (dots) and fitting (line) when Pl = 9. The inset shows the TCMT model of OTS in the structure. (d) Fitting parameters γ1, γ2, and γ3 versus Pl. (e) Absorption spectra of MoS2 in the structure with different Pr when Pl = 9. The inset shows the absorption spectra around the peaks. (f) Fitting parameters γ1, γ2, and γ3 versus Pr. Here, al = 82 nm, bl = 44 nm, ar = 149 nm, br = 130 nm, and θ = 0°.
    Fig. 4. (a) Light absorption spectra of MoS2 monolayer in the multilayer structure with different period numbers Pl when Pr = 20. (b) Absorption peak values of MoS2 as a function of Pl, and the wavelengths of MoS2 absorption peak and OTS as a function of Pl. (c) Absorption spectra of MoS2 obtained by the TMM calculation (dots) and fitting (line) when Pl = 9. The inset shows the TCMT model of OTS in the structure. (d) Fitting parameters γ1, γ2, and γ3 versus Pl. (e) Absorption spectra of MoS2 in the structure with different Pr when Pl = 9. The inset shows the absorption spectra around the peaks. (f) Fitting parameters γ1, γ2, and γ3 versus Pr. Here, al = 82 nm, bl = 44 nm, ar = 149 nm, br = 130 nm, and θ = 0°.
    Yangwu Li, Hua Lu, Jiadeng Zheng, Shichang Li, Xiao Xuan, Jianlin Zhao. Perfect light absorption in monolayer MoS2 empowered by optical Tamm states[J]. Chinese Optics Letters, 2021, 19(10): 103801
    Download Citation