• Acta Photonica Sinica
  • Vol. 49, Issue 3, 0330002 (2020)
Peng CHEN1, Zhi ZHAO2, Dong-dong ZHAO1、*, Yang-yang HAN2, and Rong-hua LIANG1
Author Affiliations
  • 1College of Computer Science and Technology, Zhejiang University of Technology, Hangzhou 310023, China
  • 2College of Information and Engineering, Zhejiang University of Technology, Hangzhou 310023, China
  • show less
    DOI: 10.3788/gzxb20204903.0330002 Cite this Article
    Peng CHEN, Zhi ZHAO, Dong-dong ZHAO, Yang-yang HAN, Rong-hua LIANG. Detection Method of Dissolved Oxygen Concentration in Water Based on Single Source Frequency Domain Fluorescence Lifetime[J]. Acta Photonica Sinica, 2020, 49(3): 0330002 Copy Citation Text show less
    Design of detecting dissolved oxygen device based on frequency-domain fluorescence lifetime
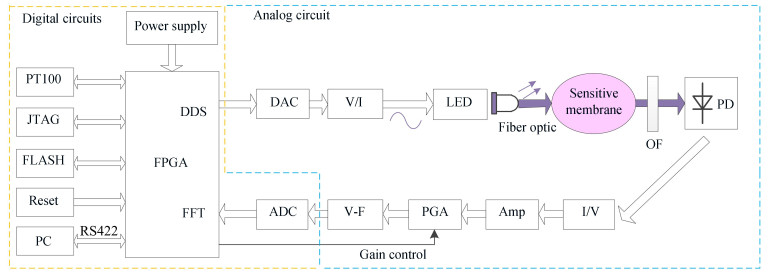
    Fig. 1. Design of detecting dissolved oxygen device based on frequency-domain fluorescence lifetime
    Structure of optical path
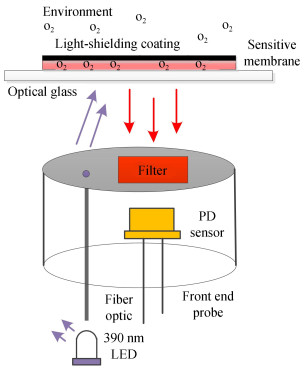
    Fig. 2. Structure of optical path
    Flowchart for detecting dissolved oxygen by the means of single source frequency-domain fluorescence lifetime
    Fig. 3. Flowchart for detecting dissolved oxygen by the means of single source frequency-domain fluorescence lifetime
    Detection principle of single light source phase modulation
    Fig. 4. Detection principle of single light source phase modulation
    Fabrication of artificial fingers and fingerprints film
    Fig. 5. Fabrication of artificial fingers and fingerprints film
    Calibration chart of the proposed method
    Fig. 6. Calibration chart of the proposed method
    Fluorescence lifetime trend with temperature increase
    Fig. 7. Fluorescence lifetime trend with temperature increase
    Comparison chart of instrument data
    Fig. 8. Comparison chart of instrument data
    O2:N2/%[O2]/(mg·L-1)θ1/(°)Δτ/μsτdo
    21:798.963-69.12533.1075.152
    10:904.296-71.18027.1934.944
    5:952.062-73.82019.6982.901
    1:990.404-78.3886.9161.903
    0.01:99.990.033-80.5320.9561.200
    0:1000.008-80.87601.024
    Table 1. Results of dissolved oxygen concentration
    [O2]/(mg·L-1)τdoTest results/(mg·L-1)Deviation/(mg·L-1)
    8.9634.9448.960-0.003
    4.2962.9014.3090.013
    2.0621.9032.039-0.023
    0.4041.2000.4380.034
    0.0331.0240.0370.004
    0.0081.000-0.017-0.025
    Table 2. Error analysis
    [O2]/(mg·L-1)Linear relationship|Δ|max/(mg·L-1)Error radio/%
    0~5[O2]=2.276×τdo-2.292≤|0.03|0.6
    5~9[O2]=2.276×τdo-2.292≤|0.04|0.5
    Table 3. Segmentation analysis of experimental results
    Detection methodMeasurements/(mg·L-1)Average value/(mg·L-1)Standard deviation/(mg·L-1)Relative standard deviation/%
    12345
    DOP1 sensor4.2504.2424.2544.2334.2634.2480.0110.27
    Proposed method4.2244.2264.2354.2424.2334.2320.0070.18
    Table 4. Analysis of stability and effectiveness
    Detection methodThe dissolved oxygen concentration to be detected AB/s
    0%→21%(90%)21%→0%(90%)0%→21%(95%)21%→0%(95%)
    DOP1 sensor35364345
    Proposed method21262337
    Table 5. Analysis of stability and effectiveness
    Peng CHEN, Zhi ZHAO, Dong-dong ZHAO, Yang-yang HAN, Rong-hua LIANG. Detection Method of Dissolved Oxygen Concentration in Water Based on Single Source Frequency Domain Fluorescence Lifetime[J]. Acta Photonica Sinica, 2020, 49(3): 0330002
    Download Citation