
刚刚 邱, 新 李, 小兵 郑, 静 闫, 彦港 孙. Autonomous vicarious calibration based on automated test-site radiometer[J]. Chinese Optics Letters, 2016, 14(12): 121201
- Chinese Optics Letters
- Vol. 14, Issue 12, 121201 (2016)
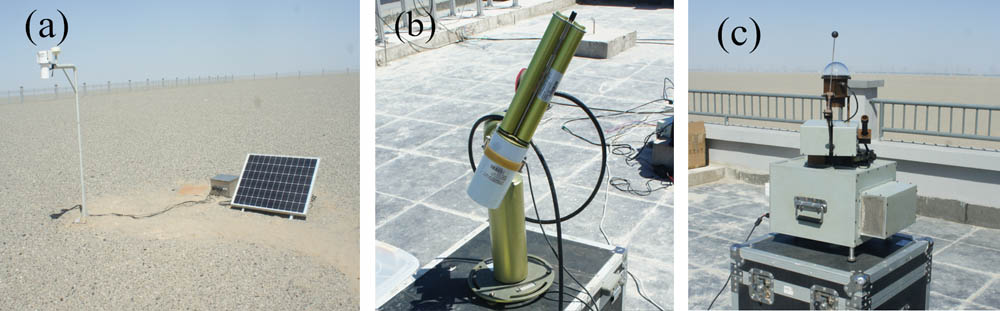
Fig. 1. AVCS. (a) ATR, (b) Cimel sunphotometer, and (c) automated diffuser-to-globe irradiance meter.
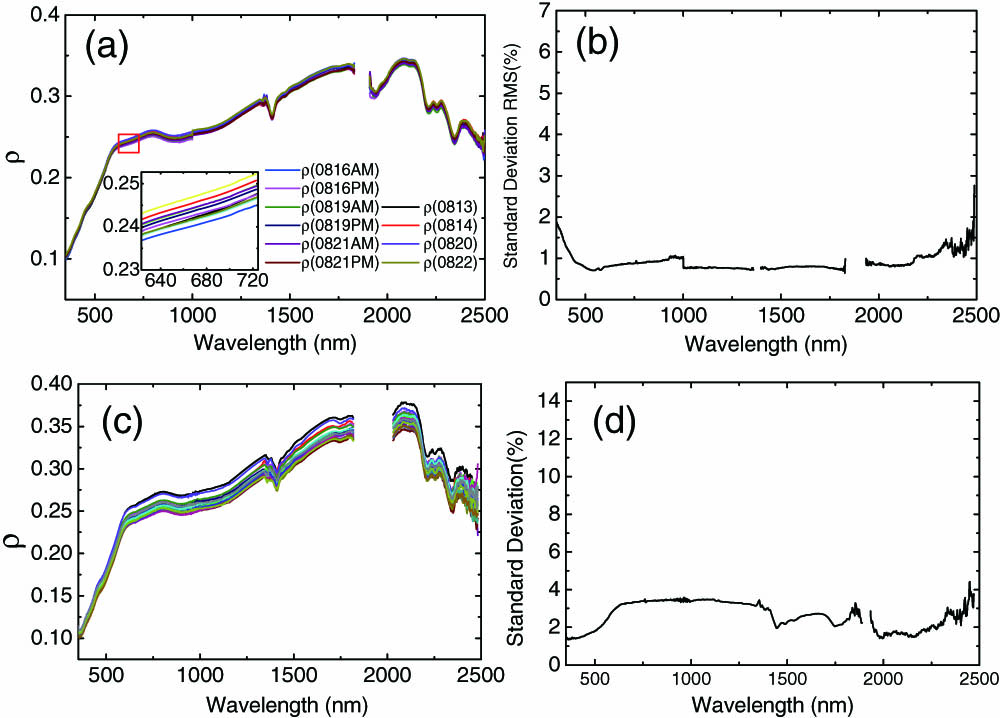
Fig. 2. (a) The reflectance curves in the central area of CRCS (10 km × 10 km 200 m × 200 m
Fig. 3. Surface reflectance versus wavelength for Dunhuang Gobi on August 19, 2015 and the NSR of the ATR and MODIS. The surface reflectance was obtained by personnel using an SVC. A standard panel is used as a reflectance standard during this measurement.
|
Table 1. Calibration Results by Traditional Approach
|
Table 2. Parameter at Overpass Time
|
Table 3. Predicted and AQUA/MODIS TOA Radiance Comparison
|
Table 4. Predicted and TERRA/MODIS TOA Radiance Comparison
|
Table 5. Uncertainty of AORC

Set citation alerts for the article
Please enter your email address
© Copyright 2018-2021 | Chinese Laser Press. All Rights Reserved 沪ICP备15018463号-20