1Key Laboratory of Optical Calibration and Characterization, Anhui Institute of Optics and Fine Mechanics, Chinese Academy of Sciences, Hefei 230031, China
2University of Sciences and Technology of China, Hefei 230031, China
3Shanghai Maritime University, Shanghai 201306, China
We employ the in-site automated observation radiometric calibration (AORC) approach to perform vicarious calibration, which does not require the manual efforts of a field team to measure the surface conditions. By using an automated test-site radiometer (ATR), the surface radiance at any moment in time can be obtained. This Letter describes the AORC approach and makes use of data to compute top-of-atmosphere radiance and compare it to measurements from the Moderate Resolution Imaging Spectroradiometer. The result shows that the relative deviation is less than 5% and the uncertainty is less than 6.2%, which indicates that the in-site AORC maintains an accuracy level on par with traditional calibration.
Vicarious calibration, in place of laboratory calibration[1,2], is the process of determining the radiometric calibration of an on-orbit or aircraft sensor using an external source. During a sensor overpass, personnel are present at a test-site to make in situ measurements of the atmospheric and surface conditions[3–5]. These data are inputed to a radiative transfer code, which then computes top-of-atmosphere (TOA) spectral radiances. Surface inhomogeneity, surface bi-directional reflectance distribution function (BRDF), clouds, haze, and the radiative transfer relationship between the surface and aperture are the major error contributors to the process[6,7]. These limit vicarious calibration accuracy to a 3%–7% level[2,3–5]. Nevertheless, vicious calibration is useful to supplement on-board calibration and to provide an independent assessment of radiometric accuracy[8,9].
A drawback of the traditional approach to vicarious calibration is the need to deploy a ground truth team to collect measurements at the time of sensor overpass[10,11]. The field campaigns are limited by the remote locations of the calibration sites, personnel availability, foul weather, and equipment failures[7]. The act of driving or even walking on the calibration site can change its reflectance[2,7]. These difficulties lead to lack of temporal data, making it impossible to establish long-term trends in sensor performance. With the sharp increase in satellite numbers and species, this difficulty is exacerbated[8]. The concept of performing the automated vicarious calibration approach was developed to address these concerns.
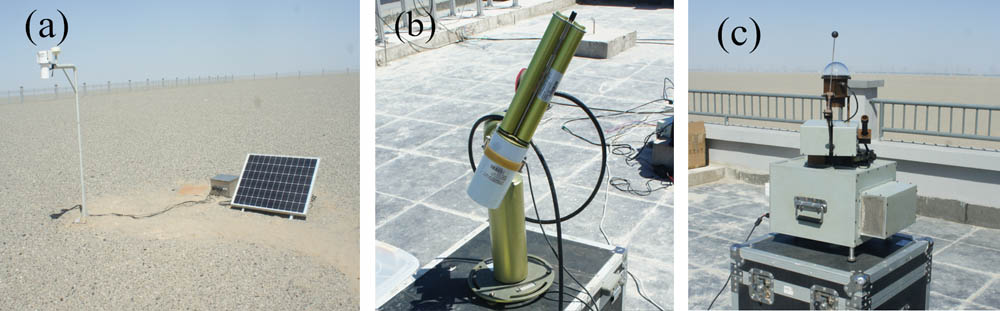
The automated approach to the reflectance-based method aims at collecting data with a greater temporal sampling rate in the absence of ground personnel, while maintaining radiometric accuracy on par with manned field campaigns[2,7,8]. We employ permanent automated instruments, such as an automated test-site radiometer (ATR), as shown in Fig. 1(a), for surface radiance[12], a Cimel sun photometer[13–15], as shown in Fig. 1(b), for atmospheric characteristics[16,17], and an automated diffuser-to-globe irradiance meter, as shown in Fig. 1(c), for the field diffuser-to-globe factor, as a prototype of the automated vicarious calibration system (AVCS). These were deployed on the edge (94.41°E, 40.09°N) of the China Radiometric Calibration Site (CRCS), situated on a homogeneous section of alluvial fan at the west of Dunhuang city in August 2015, to determine the feasibility of implementing automated vicarious calibration. This Letter documents the use of AVCS and the process of automated observation radiometric calibration (AORC) compared to the reflectance-based method and reports the TOA radiance in comparison with Moderate Resolution Imaging Spectroradiometer (MODIS) imagery.
Sign up for Chinese Optics Letters TOC. Get the latest issue of Chinese Optics Letters delivered right to you!Sign up now
The ATR was developed and used to measure the surface radiance, which samples the spectrum at 8 independent bands, with interference filters with bandwidth ranging from about 20–40 nm, coupled with silicon and InGaAs detectors[18]. The field of view (FOV) of each channel is 10° with a parallel optical axis. An active thermostatic system maintains components sensitive to temperature change, interference filters and semiconductor detectors with their signal processing circuits, surrounded by a thermal insulation material, at 20°C–30°C in order to avoid non-uniform spectral responsivities and improve the stability and accuracy of the measurements[19]. The ATR is mounted at the top of a bracket that is a distance of 1.8 m from the ground, so the corresponding spot size on the ground is approximately 30 cm in diameter. Surface radiance measurements are reported every three minutes. The ATR uploads data via China’s BeiDou Navigation Satellite System (BDS) terminator to a server at the office. A Cimel sun photometer, provided by the National Satellite Meteorological Center, measures the solar irradiance every minute for the aerosol optical depth (AOD). An automated diffuser-to-globe irradiance meter, developed by the Anhui Institute of Optics and Fine Mechanics, automatically obtains the hemisphere diffuser and globe hyperspectral irradiance every ten minutes. The diffuser-to-globe factor contributes to improving the accuracy of globe irradiance in place of the result calculated by MODTRAN in ideal weather conditions.
AORC does not mean staff members are completely unnecessary. Area reflectance is periodically determined via traditional means during manned deployments using a field-portable spectroradiometer made by Spectra Vista Corporation (SVC) and a standard panel. These SVC data are then scaled by the ratio of the ATR output at the time of the sensor overpass to that measured during the SVC collection campaign[2,7]. We carried out a field campaign arranged in a square area near the ATR at the noon on August 19, 2015, a very good day, and calibrated for AQUA/MODIS using a traditional approach[20,21]. The percent differences between the predicted and MODIS spectral radiances in band 1–4 were all less than 1.1%, as show in Table 1, which indicated that the reflectance curve agreed with the actual situation. In addition, it also benefited from a small viewing angle, 3.96°, which minimized the error generated by the BRDF model. However, the field area measured by the SVC is too small and limited by the staff. For a 250 m footprint, a site of at least 750 m is appropriate.
AQUA/MODIS
Predicted radiance (W·(m2·sr·μm)−1)
MODIS radiance (W·(m2·sr·μm)−1)
Percent difference (%)
Band 1
99.137
98.330
0.819
Band 2
65.804
65.107
1.071
Band 3
107.867
108.577
−0.653
Band 4
102.444
103.013
−0.552
Table 1. Calibration Results by Traditional Approach
The surface reflectance on the Gobi may vary slightly due to moisture and local compositional changes brought about by wind and rain[2]. The variation of the CRCS’s surface reflectance is less than 1.5% each year from 1999 to 2014[22], except for a variation of 3% from 2014 to 2015. Historical records, as shown in Fig. 2, have demonstrated that the relative spectral shape remains invariant and there is only a small change in the amplitude. The temporal stability [Figs. 2(a) and 2(b)] and spatial uniformity [Figs. 2(c) and 2(d)] are the foundation and precondition of the AORC. The normalized spectral responsivities (NSRs) of the MODIS and ATR are shown in Fig. 3. Although there it is slightly different in the center wavelength and shape, it is relatively flat throughout the visible range and only increases slightly below a wavelength of 600 nm. This allows for band-to-band vicarious calibration for MODIS using the ATR.
Figure 2.(a) The reflectance curves in the central area of CRCS () from an analytical spectral device (ASD) field spectrometer at August 13–22, 2015. (b) The relative root mean square (RMS) deviation of the surface reflectance at the central area is in a range that is less than 2% than 350–500 nm and less than 1% from 500–2500 nm. (c) The reflectance curves of 11 measured points, from the SVC, in the square area near the ATR on August 19, 2015. (d) The RMS deviation of reflectance is less than 3.4% within the whole band.
Figure 3.Surface reflectance versus wavelength for Dunhuang Gobi on August 19, 2015 and the NSR of the ATR and MODIS. The surface reflectance was obtained by personnel using an SVC. A standard panel is used as a reflectance standard during this measurement.
For this reason, we wish to determine the change of the surface reflectance relative to the measurements obtained by the SVC on August 19, 2015. Let the SVC-measured reflectance be obtained by where is the output of the SVC at , is the solar zenith at , 0° is the SVC viewing angle, is the bi-directional reflectance factor for the standard panel, and is the spectral hemispheric reflectance for the standard panel. The ATR-measured reflectance synchronously with the field campaign be obtained by where is the solar zenith at any arbitrary time , is the surface reflectance at , is the output of the ATR at , and is the calibration coefficient of the ATR. is the globe irradiance at the surface at , is the diffuser-to-globe factor, is the solar irradiance calculated by MODTRAN4 (MODerate spectral resolution atmospheric TRANSsmittance algorithm and computer mode 4). Assuming the reflectance by the ATR is equal to the equivalent reflectance by the SVC, we can now express the desired reflectance for any arbitrary time , , by scaling the SVC data at [1]: It is noted that not all sensors will be viewing at the nadir. A correction for a specific viewing angle is facilitated by a pre-established surface BRDF model[23,24], where is the reflectance at the sensor viewing angle, is the reflectance at the nadir, is the solar azimuth angle, is the sensor viewing azimuth angle, is the sensor viewing zenith angle, and is the BRDF correction factor.
The spectral responsivity of the corresponding bands between MODIS and ATR is not completely consistent, so we need to calculate the response matching factor : where is the hyperspectral surface reflectance obtained by the SVC, is the NSR of MODIS, shown as the blue lines in Fig. 3, and , shown as the red lines in Fig. 3, is the NSR of the ATR. The equivalent reflectance of MODIS at its viewing angle may be expressed as where is the BRDF correction factor. We calibrated for AQUA/MODIS and TERRA/MODIS using the AVCS on August 21, 2015. The parameters, listed in Table 2, are used as input to the MODTRAN4 radiative transfer code, and the TOA radiances are produced. The ozone column is obtained from the website of Ozone & Air Quality, NASA. The water column is obtained from the website of the Department of Atmospheric Science, College of Engineering, University of Wyoming. We take the areas of pixels, which accounts for the fact that the measurement area might not encompass one pure pixel in an image and also for the modulation transfer function (MTF) characteristics of the sensor[6].
The comparison of the at-sensor spectral radiance data between MODIS and AVCS is summarized in Tables 3 and 4. The results show that the percent differences of MODIS and the predicted radiance in bands 1–4 are all less than 5%, which demonstrates that the automated calibration approach is sound and at the same accuracy level as the traditional approach. Almost all the predicted spectral radiances are less than the MODIS radiance, which may be from the water column. The Cimel data cannot retrieve the water column, as we do not have the parameters associated with the shape and location of the transmission of the filter at the 936 nm channel. The sounding balloon data of Dunhuang are adopted. The weakness is that every day, only two temporal measurements at 12Z and 0Z are taken. The water column at noon is slightly lower than at other moments in the day. The percent differences between the predicted and MODIS spectral radiance of each channel are larger than the manual approach. The inhomogeneous surface is one possible explanation for the differences. The spot projecting on the ground only views a small area, which does not represent the reflectance characteristic of the entire calibration site. It may be slightly higher or lower than the mean reflectance in a certain wavelength range. The shadows of pebbles and the cracks in the ground will change with the sun’s zenith angle and azimuth angle and then result in the variations of the measurements of the surface reflectance.
AQUA/MODIS
Predicted radiance (W·(m2·sr·μm)−1)
MODIS radiance (W·(m2·sr·μm)−1)
Relative difference (%)
Band 1
93.713
96.466
−2.853
Band 2
61.204
64.379
−4.933
Band 3
104.529
105.734
−1.140
Band 4
97.830
100.612
−2.764
Table 3. Predicted and AQUA/MODIS TOA Radiance Comparison
The uncertainty of radiometric calibration in the reflectance-based approach is mainly from the surface spectral measurement, atmospheric parameter measurements, and radiative transfer code. The measurement uncertainties in bands 1–4 caused by insufficient amounts of ATR are 3.1%, 2.8%, 4.0%, and 3.5%, and the field non-uniform uncertainties are 3.2%, 3.4%, 1.5%, and 2.2% respectively. The uncertainty of the surface reflectance measurement is within 4.1%–4.5%. Taking the error margin of the surface reflectance as the input, new calibration coefficients can be obtained by running the radiative transfer code again. The relative differences between the true values of the calibration coefficient and the newly calculated results can be as the uncertainties of the surface reflectance. The uncertainties contributed by other factors refer to the analysis by Biggar et al.[25]. The total uncertainty can be expressed by the square root of the main factors[26]. The error sources and corresponding uncertainties are summarized in Table 5.
In conclusion, we calibrate AQUA/MODIS and TERRA/MODIS in bands 1–4 using AVCS on August 21, 2015, and the agreements with MODIS are within 5%, which verifies the feasibility of the automated observation calibration approach. The key to this approach is to obtain the surface reflectance from the ATR. The biggest advantage lies in the fact that the new approach does not require the presence of a ground crew; as long as the weather conditions allow and there is an overpass, the calibration can be implemented. It fills in temporal data gaps by the long time intervals of its field campaigns. It can clearly improve the calibration frequency to monitor the change of the sensor response, guaranteeing the quality of remote sensing data. Although there is now only one ATR in the AVCS, the scale of surface reflectance will be influenced to a large extent by the ground spot projected by the ATR, which increases the reflectance error if the ground spot changes or is not uniform with the whole site.