• Journal of Geographical Sciences
  • Vol. 30, Issue 8, 1341 (2020)
Kaiyong WANG1、2、* and Fuyuan WANG1、2
Author Affiliations
  • 1Institute of Geographic Sciences and Natural Resources Research, CAS, Beijing 100101, China
  • 2Key Laboratory of Regional Sustainable Development Modeling, CAS, Beijing 100101, China
  • show less
    DOI: 10.1007/s11442-020-1785-9 Cite this Article
    Kaiyong WANG, Fuyuan WANG. Theory and measurement model of administrative region potential from a perspective of administrative division adjustment: Taking Chongqing city as a case study[J]. Journal of Geographical Sciences, 2020, 30(8): 1341 Copy Citation Text show less
    Map showing Chongqing's administrative division
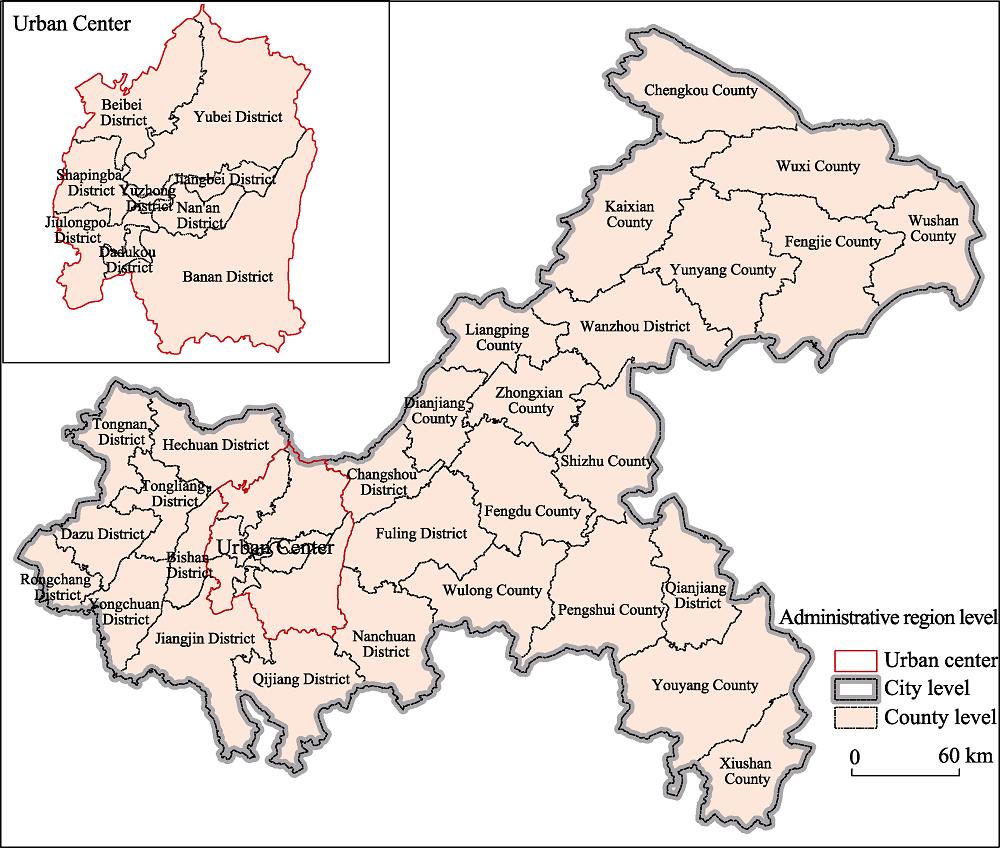
    Fig. 1. Map showing Chongqing's administrative division
    Change in Chongqing's GDP and its ratio of national GDP 1984-2014 [GDP (hundreds of millions yuan)/ratio/GDP (hundreds of millions yuan), per capita GDP ratio, ratio of Chongqing per capita GDP to Sichuan per capita GDP]
    Fig. 2. Change in Chongqing's GDP and its ratio of national GDP 1984-2014 [GDP (hundreds of millions yuan)/ratio/GDP (hundreds of millions yuan), per capita GDP ratio, ratio of Chongqing per capita GDP to Sichuan per capita GDP]
    Administrative potential indicator values for Chongqing 1984-2014
    Fig. 3. Administrative potential indicator values for Chongqing 1984-2014
    Overall administrative region potential of Chongqing 1984-2014[Chongqing's administrative region potential/per capita GDP status//year//Chongqing's administrative region potential (X)/Chongqing's per capita GDP status (Y)]
    Fig. 4. Overall administrative region potential of Chongqing 1984-2014[Chongqing's administrative region potential/per capita GDP status//year//Chongqing's administrative region potential (X)/Chongqing's per capita GDP status (Y)]
    DateAdministrative division adjustment content
    Mar-Aug 1992The three counties of Yongchuan County, Jiangjin County and Hechuan County were redesignated as cities and incorporated into Chongqing Municipality.
    Mar 1, 1995Chongqing Municipality's previous 9 municipal districts, 3 county-level cities and 9 counties were adjusted into 11 municipal districts, 3 county-level cities and 7 counties, expanding the administrative regions of the Central District, Jiangbei District, Nan'an District, Shapingba District, Jiulongpo District, Dadukou District and Beibei District. Baxian County and Jiangbei County were abolished, and Banan District and Yubei District were established. After the adjusting these districts, Chongqing's main urban area increased from 931.1 km2 to 5472.8 km2 (Xinhuanet, 2009).
    Sep 15, 1996Central government approves incorporating Wanxian City, Fuling City and Qianjiang District into Chongqing Municipality.
    Jun 18, 1997Chongqing upgraded to become the fourth municipality directly under the central government in China.
    Dec 20, 1998Chongqing Municipality abolished Wanxian City and its jurisdictions of Longbao, Tiancheng and Wuqiao districts, and established Wanzhou District and set up Wanzhou Immigration Development Zone. It also abolished Fuling City, Zhicheng District and Lidu District, and established Fuling District.
    Dec 25, 2001Changshou County redesignated as Changshou District.
    Oct 22, 2006Jiangjin, Hechuan, Yongchuan and Nanchuan cities were redesignated as municipal districts, significantly increasing the area of built-up municipal districts that year.
    Oct 27, 2011Wansheng District and Qijiang County were abolished, and Qijiang District and Wansheng Economic and Technological Development Zone were established; Shuangqiao District and Dazu County were abolished, and Dazu District and Shuangqiao Economic and Technological Development Zone were established.
    May 2, 2014Tongliang and Daishan counties were redesignated as municipal districts, giving Chongqing jurisdiction over a total of 21 municipal districts, 13 counties and 4 autonomous counties.
    Table 1.

    The administrative division adjustments of Chongqing from 1984 to 2014

    ElementIndicatorEquationMeaning of variables
    Dependent variablePer capita GDP ratio (AGP)$AG{{P}_{t}}=\frac{GD{{P}_{t}}/PO{{P}_{t}}}{TGD{{P}_{t}}/TPO{{P}_{t}}}$. (11).GDPt: local GDP in year tTGDPt: GDP in year tPOPt: permanent population of Chongqing in year tTPOPt: permanent population of China in year t
    SConstruction land area (LP)$L{{P}_{t}}=\frac{B{{A}_{t}}/PO{{P}_{t}}}{TB{{A}_{t}}/TPO{{P}_{t}}}\text{*}\left( 1-\frac{GD{{P}_{t}}}{TGD{{P}_{t}}} \right)$. (12-1).BAt: built-up area of the administrative region in year tTBAt: total built-up area in nationwide urban areas in year t
    Human capital ratio (HCP)$HC{{P}_{t}}=\frac{C{{S}_{t}}/PO{{P}_{t}}\text{*}10000}{TC{{S}_{t}}/TPO{{P}_{t}}\text{*}10000}\text{*}\left( 1-\frac{GD{{P}_{t}}}{TGD{{P}_{t}}} \right)$. (12-2).CSt: number of local college students in year tTCSt:: number of college students nationwide in year t
    Fixed-asset investment ratio (FTP)$FT{{P}_{t}}=\frac{F{{S}_{t}}/PO{{P}_{t}}}{TF{{S}_{t}}/TPO{{P}_{t}}}\text{*}\left( 1-\frac{GD{{P}_{t}}}{TGD{{P}_{t}}} \right).$ (12-3).FIt: local fixed-asset investment in year tTFIt:: national fixed-asset investment in year t
    QFiscal decentralization of admin region (FD)$F{{D}_{t}}=\frac{F{{S}_{t}}/PO{{P}_{t}}}{F{{S}_{t}}/PO{{P}_{t}}+CGF{{S}_{t}}/TPO{{P}_{t}}}\text{*}(1-\frac{GD{{P}_{t}}}{TGD{{P}_{t}}})$. (12-4).FSt: local fiscal expenditure in year tCGFSt: central fiscal expenditure in year tGDPt: GRP in year tTGDPt: GDP in year t
    Local administrative decentralization (AD)$A{{D}_{t}}=\frac{P{{S}_{t}}/PO{{P}_{t}}*10000}{TP{{S}_{t}}/TPO{{P}_{t}}*10000}\text{*}\left( 1-\frac{GD{{P}_{t}}}{TGD{{P}_{t}}} \right).$ (12-5).PSt: number of local public administration and social organization workers in year tTPSt:: number of national local public administration and social organization workers in year t
    Table 2.

    Equations for measuring administrative region potential indicators

    SequenceADF test statistical valueProb.OrderMethodConclusion
    Administrative region potential-4.6940.0041Trend and interceptStable
    Per capita GDP ratio-5.6790.0001Trend and interceptStable
    Per capita foreign exports-6.8370.0001Trend and interceptStable
    Non-agricultural population rate-5.3790.0011Trend and interceptStable
    Employment level-4.4870.0091Trend and interceptStable
    Table 3.

    Results of the unit root test of variables

    VariableCoefficientStd. errort-StatisticProb
    Constant term0.6090.05211.7170.000
    Administrative region potential0.6040.1105.4770.000
    Non-agricultural population-0.0090.218-0.0400.969
    Per capita foreign exports0.1070.0353.0510.005
    WCD program*administrative region potential-0.0410.027-1.5410.136
    Employment level-0.1670.040-4.2030.000
    R2=0.963 Adjusted R2 =0.956 F=131.583 DW=1.404
    Table 4.

    Equation (16) parameter estimation results

    Kaiyong WANG, Fuyuan WANG. Theory and measurement model of administrative region potential from a perspective of administrative division adjustment: Taking Chongqing city as a case study[J]. Journal of Geographical Sciences, 2020, 30(8): 1341
    Download Citation