• Journal of Geographical Sciences
  • Vol. 30, Issue 8, 1341 (2020)
Kaiyong WANG1、2、* and Fuyuan WANG1、2
Author Affiliations
  • 1Institute of Geographic Sciences and Natural Resources Research, CAS, Beijing 100101, China
  • 2Key Laboratory of Regional Sustainable Development Modeling, CAS, Beijing 100101, China
  • show less
    DOI: 10.1007/s11442-020-1785-9 Cite this Article
    Kaiyong WANG, Fuyuan WANG. Theory and measurement model of administrative region potential from a perspective of administrative division adjustment: Taking Chongqing city as a case study[J]. Journal of Geographical Sciences, 2020, 30(8): 1341 Copy Citation Text show less

    Abstract

    There is a lack of basic theory and method to examine the effect of administrative division (AD) adjustment on the regional development. Based on the theory and practice of Chinese AD adjustments, the paper defined the concept of administrative region potential (ARP) and developed the quantitative model to measure the ARP. Then, the model was validated taking Chongqing as an empirical case. The results show that: (1) the ARP consists of energy of position (i.e., geographic space factors) and gravitational potential energy (i.e., administrative levels and management system factors). Administrative division adjustment can change the ARP, thereby changing its path and driving force of regional development. (2) The ARP model of Chongqing city can reflect the effects of administrative division adjustment events on the Chongqing city objectively. Specifically, ARP includes variables of land jurisdiction, human capital level, fixed assets investment capacity, administrative hierarchy of fiscal decentralization and administrative decentralization. (3) The ARP promotion has significant positive influence on the performance of local economic development in Chongqing city. (4) Reasonable AD adjustments will help the region integrate production elements and resources, enhance the political power of the city, improve its ARP, and then promote local economic development. The ARP model is proved to be an efficient way to understand and explain the regional effect of AD adjustment. It provides a new analytical perspective for the planning of AD adjustment in various regions, and can also be used as a practical method for assessing the effects of AD adjustment.

    1 Introduction

    Administrative divisions are a system of regional divisions for a state to implement hierarchical administrative management. It is a form of division of administrative regions and top-level design of an administrative management system. Administrative divisions are an important part of state governance and a basis for redistributing state power and formulating policies, and their rationality has a major impact on regional development (Ma et al., 2009). The different levels of administrative units in the administrative division system are called administrative regions or administrative districts. Since 1978, to meet the needs of economic and social development, China has carried out frequent administrative division adjustment. These include two major adjustments of provincial administrative divisions, namely, the establishment of Hainan Province in 1988 and Chongqing Municipality in 1997. There have been more frequent adjustments below the provincial level, mainly prefectures and counties being redesignated as cities, counties being redesignated as municipal districts and villages being incorporated into towns. Empirical and rational administrative division adjustments can effectively stimulate the development potential of administrative regions, their development, and enhance their competitive position in a region and the country by optimizing allocations of administrative resources, thereby creating suitable administrative levels, affiliations and administrative authority. In other words, it is believed that administrative division adjustments change the potential of administrative regions.

    The concept of “potential” comes from physics and means the capacity to develop into something in the future. Potential energy is due to interactions between objects and determined by the relative positions of objects. It is also affected by the mass and height of objects. There are subtle differences in specific applications of potential energy, as it relates to vertical forces such as height, including gravitational potential energy (Cai, 2017), and as it relates to horizontal forces, such as that produced by the collision of continental plates (Zhang et al., 2002). In China's administrative division system, the population size, resources and scale of industry under an area's jurisdiction, as well as the level and authority of an administrative region, determine whether its position in regional development is favorable (Liu, 2006). These elements are comparable to the mass and height of an object and are thus similar to the gravitational potential energy of an object.

    The concept of potential energy has previously been applied in the field of economic geography. Some researchers have proposed the concept of location potential to measure the competitiveness of ports and their status in regional logistics systems (Peng, 2013). Drawing on this, this paper applies the concept of potential energy to the study of administrative divisions and proposes the concept of administrative region potential to describe the development potential of local administrative divisions.

    Administrative region potential is a new concept, and there is still a lack of research on the topic. Relevant research mainly consists of studies on the impact of administrative divisions on local development. The focus of such research is to verify the positive effects of adjustments to administrative divisions on local development. For example, Wang et al. (2002) used the synthetic control method to estimate the impact of administrative division adjustment on regional economic growth and found that adjustments had a significant positive effect on the economic growth of Chongqing. Fan et al. (2012) used county (and city) panel data and the difference-in-difference (or “double-difference”) method to discover that the policy of redesignating counties as cities did not promote urbanization and economic growth. An important reason was that the cities created by the policy were too small to form agglomeration effects. Tang et al. (2015) expanded the scope of their sample and found that the reform to turn counties into municipal districts significantly increased the population growth rates of cities and municipal districts. This change is mainly attributed to the influxes of people from counties (and municipal districts) and from other provinces. Cities in eastern China and cities with greater potential markets had more distinct population agglomeration effects. Gao et al. (2015) found that the impact of administrative division adjustment on regional economic growth varied by location and was not always positive. This kind of research mainly uses the synthetic control and double-difference methods to evaluate the effect of policies and to verify the effect of adjustments on local development, but they offer no systematic theoretical explanation for the regional effects of administrative division adjustment.

    Existing interpretative research on the impact on local development of setting or adjusting administrative divisions is relatively fragmented. They may explain the impact from two perspectives. The first is the change in geographical space of an administrative region. Research shows that administrative division adjustment guides local development by effectively integrating regional resources (Yu et al., 2006), expanding new urban growth spaces, increasing the population and size of industry under jurisdiction (Shang et al., 2006), and optimizing urban spatial structures (Wang et al., 2006). Administrative division adjustment also coordinates administrative divisions with natural divisions, urban system divisions, transportation network patterns, major function zoning and population distribution, thereby effectively promoting local economic and social development (Yang et al., 2013). The second perspective is the change to the administrative system. The administrative levels, barriers between regions, central-local relationships, cities leading the division of counties and other factors associated with administrative division all affect the methods and effects of regional spatial governance (Liu et al., 2014). Administrative decentralization, fiscal decentralization, political incentives for local officials and regional competition may all generate positive effects on administrative division adjustment (Wang et al., 2002). Decentralization has always been considered a driving force of regional growth (Qian et al., 1998; Qian et al., 1997), with studies finding that local decentralization increases the economic efficiency of cities specially designated in the state plan (Shi et al., 2007). Financial autonomy gives local governments greater incentives to pursue economic development (Lin et al., 2007). Empirical studies have found that provincial fiscal decentralization in China promotes economic growth and improves supplies of local public goods (Gong et al., 1998; Chen et al., 2010). As a result, improving the fiscal decentralization system, especially in backward areas, can increase overall efficiency of investment in public goods (Shen et al., 2007). Moreover, administrative levels are closely related to urban development. The central government provides greater support to cities with higher administrative levels, such as preferential allocations of various resources and access to more public resources, which stimulates population and industry agglomeration, and promote urban development (Henderson et al., 2007; Cai et al., 2011).

    Overall, previous research has examined the positive effects of administrative division adjustment by analyzing the influence of adjustments on local development in terms of geographical space and institutional space. Nevertheless, there is still a lack of theory-based systematic interpretations and quantitative models for measuring how administrative divisions affect local economic development. The purpose of this study is to develop the concept of administrative region potential and to create a model to measure it, to verify and explain the impact of adjusting administrative divisions on local economic development. Following a theoretical analysis of administrative region potential, Chongqing is used as a research area and key indicators are selected to measure administrative region potential quantitatively and empirically test its effect on local economic performance.

    2 Theory and model of administrative region potential

    2.1 From the theory of potential to the theory of administrative region potential

    The application of the theory of potential to regional economics has a long history, with early scholars applying the theory of gravitational potential energy to create the concepts of population potential and market potential (Pan, 2006). Based on the theory of spatial interaction, economic geographers proposed the concept of location potential, which reflects the location conditions and development potential of a place. It is a measure of a place's importance and competitiveness in a specific regional system, and it reflects the opportunity and probability of interactions between different groups in a certain location and regional system. Location potential has been applied to research on ports, leading to the concept of seaport location potential, which represents the competitiveness of a port among all the ports in each region. This is measured as a port's proportion of the total port location potential of a region (Dong et al., 2006). Some studies have defined urban sub-CBD location potential as the size of an urban area's land use economic advantages and expressed sub-CBD relative location potential as a ratio of an inner-city reference area (Chen et al., 2000). Taken together, although the concept of potential has different applications, it basically focuses on the capacity of an entity to integrate resources and concentrate production factors, thereby reflecting the relative position of that entity within a region. In general, the greater the potential, the greater the competitive position of the entity.

    Drawing on applications of potential in economic geography, this paper introduces it to the field of administrative division research. Administrative region potential refers to the status and development potential of an administrative region within a regional or national administrative division structure. It includes the two elements of potential. One is the capacity to concentrate and allocate the production factors of an administrative region, which is referred to as “potential (S)” in this study to express the potential energy of administrative region in horizontal direction; and the other is government competitiveness composed of administrative system factors, such as the relationship of administrative subordination, administrative level, administrative power and policy advantages, which is referred to as “potential (Q)” to express the potential energy of administrative region in vertical direction. Administrative division adjustment can change these two elements of potential, thus fundamentally changing the development foundation and capacity of an administrative region, and thus affecting the development pattern of an entire region. Upgrading an administrative region or changing a relationship of administrative subordination primarily changes the potential (Q) of an administrative region within the regional administrative division; whereas, adjusting administrative scope changes the potential (S).

    The main purpose of China's current administrative division adjustment is to strengthen local economic management and effective allocation of resources. Administrative region potential reflects an administrative region's level within a country and region as well as its ability to integrate resources. Adjusting administrative levels, relationships of administrative subordination and the scope of an administrative region, as well as making corresponding changes to the administrative management system, can change the administrative region potential of a city within a region and country and raise the status of the regional economy in the country. Administrative division adjustment can also change an area's relationships with other administrative regions, affecting its relative power to allocate resources relative to its ownership of production factors within national or regional administrative divisions. Sometimes there is a trade-off between administrative region potentials. Administrative division adjustment brings about corresponding changes in administrative region potential, with scientific and rational adjustments enhancing the administrative region potential of an area, and vice versa.

    2.2 Theoretical model of administrative region potential

    As a determiner of local allocations of national rights and interests (Ma et al., 2009; Seppelt et al., 2013), administrative division can be regarded as spatial projections of the state structure and its administrative authority, with the dual attributes of administrative and geographical space (Luo, 2008). Practical experience has shown that, in the current institutional context, the greater a locality's administrative factors of production and resources (mainly administrative authority and geographical space), the stronger its position in regional development, and vice versa (Zhang et al., 2002). As a result, to analyze an administrative region's potential, it is necessary to analyze both horizontal jurisdiction area and vertical administrative hierarchy (for example, administrative power) elements of potential. Potential (Q) refers to the resource allocation power of an administrative region, which is determined by its administrative level and fiscal and taxation powers and corresponds to its administrative management system. Potential (S) refers to development potential and radial agglomeration capacity, which are determined by administrative scope, jurisdiction area, population size, and industry and resources, and which correspond to the level of regional production factors and their spatial composition. Drawing on the product form of potential energy in physics and the fiscal decentralization synthesis method of Gong et al. (2010), this paper uses the following weighted product model to synthesize potential (Q) and potential (S), in order to obtain the comprehensive potential of an administrative region:

    $P{{T}_{t}}=f\left( {{Q}_{it}},{{S}_{jt}} \right)=\underset{i,j=1}{\overset{n}{\mathop \prod }}\,(Q_{it}^{{{w}_{i}}}*S_{jt}^{{{w}_{j}}})$

    where PTt is administrative region potential in year t, Qit is vertical potential energy affected by the administrative system factor i in year t, Sjt is horizontal potential energy affected by regional production factor j in year t, and wi and wj represent the weights of factors Qi and Sj, respectively.

    2.3 Specific constituent factors of administrative region potential

    2.3.1 Potential (Q): measuring competitiveness of administrative management system and administrative level

    Measuring administrative management system factors involves examining administrative region potential from the vertical dimension. The essence of administrative divisions is the spatial allocation of political and administrative power (Zhang et al., 2002). In addition to relying on market forces, all levels of government in China conduct macroeconomic regulation of urban development using administrative measures and policy guidance (Li et al., 2012). Therefore, allocation of resources and powers by central and other higher-level government affects the competitiveness of localities in national administrative division. This is an important dimension of administrative region potential. For example, under the tax-distribution system, local fiscal expenditure depends on the fiscal revenue of the government at the same level, the distribution weighting of financial resources in higher-level administrative regions and the financial resources of higher-level governments. Administrative division adjustment leads to changes in administrative relationships of subordination and administrative authority and delivers relative advantages for the development of administrative regions.

    For example, after Chongqing was upgraded from a city specially designated in the state plan to a municipality directly under the central government, its government in charge changed from the Sichuan provincial government to the central people's government. This not only resulted in an increase in fiscal autonomy, but also an increase in direct investment by the central government. In another example, in counties redesignated as municipal districts, investment in construction of basic and public service facilities increases, and development of administrative regions is accelerated, but the approval, decision-making, and fiscal powers of counties (or county-level cities) are taken back by a municipal government, leading to a weakening of fiscal powers and general authority, which is not conducive to improving local economic performance (Li et al., 2007). Therefore, comprehensively weighing experiences of setting up and adjusting administrative divisions, it is felt that the management system factors that determine administrative region potential include policy support, administrative decentralization and fiscal decentralization. Similarly, by referring to the product form of gravitational potential energy, the following equations are obtained:

    ${{A}_{it}}={{u}_{it}}p_{at}^{-1}$.
    ${{B}_{it}}=\alpha {{u}_{it}}p_{at}^{-1}+{{v}_{it}}p_{bt}^{-1}$

    where uit is the value of relevance indicator i of policy support and administrative power in year t for administrative region A; pat is the population size of administrative region A in year t; and Ait represents the per capita level of indicator i of administrative region A in year t. vit is the value of indicator i of region B in year t; Bit represents the sum of the per capita levels of indicator i for administrative region A and region B in year t; and Pbr is the population of region b in year t. A is a jurisdiction of region B. a is the adjustment coefficient, and when u $\in$ v, α = 0, but when u is independent of v, α = 1. For example, although the fiscal expenditures of all levels of government are related, they are independent of each other, so the alpha value is 1. Based on the definition of administrative region potential, and integrating equations (2) and (3), the potential of administrative factor i as well as total potential of the administrative region can be derived as follows:

    ${{Q}_{it}}={{A}_{i}}/{{B}_{i}}=\frac{{{u}_{it}}p_{at}^{-1}}{\alpha {{u}_{it}}P_{at}^{-1}+{{v}_{it}}p_{bt}^{-1}}$
    ${{Q}_{t}}=\underset{i=1}{\overset{\text{n}}{\mathop \prod }}\,{{\left( \frac{{{u}_{it}}p_{at}^{-1}}{\alpha {{u}_{it}}p_{at}^{-1}+{{v}_{it}}p_{bt}^{-1}} \right)}^{{{w}_{i}}}}$

    where Qt is potential Q of administrative region A in year t; Pat, Pbt and a represent the same as in equation (3); and uit and vit represent the value of administrative institution factor i of administrative region A and region B, respectively. wi is the weight of i factor.

    In most cases, where u $\in$ v, equation (5) can be abbreviated as follows:

    ${{Q}_{t}}=\underset{\text{i}=1}{\overset{\text{n}}{\mathop \prod }}\,{{\left( \frac{{{u}_{it}}{{p}_{bt}}}{{{v}_{it}}{{p}_{at}}} \right)}^{{{w}_{i}}}}$.

    2.3.2 Potential (S): allocation of regional production factors within a jurisdiction

    This paper considers the potential corresponding to the ability to allocate regional production factors within the jurisdiction of an administrative region from the horizontal dimension of administrative region potential. From the horizontal perspective, administrative division adjustments mainly include changes to its jurisdiction area or to its management scope and relocation of its administrative center. Scientific and rational administrative division adjustments generally optimize the reorganized jurisdiction; determine the appropriate population size, jurisdiction area, the volume of resources owned and scale of industry; promote mergers of institutions and the integration of functions; integrate and optimize resources of administrative regions; enlarge the scale of the regional economy and fiscal revenue “cake”; and enhance the overall allocation of an administrative region's resources. The Cobb-Douglas production function shows that local output is a function of local labor force and capital as well as technical inputs. If an administrative division adjustment expands the scale of a city, it will increase total labor and capital investment, promote the concentration of human and economic factors, enhance local development capacity, and greatly increase the investment efficiency of public goods, thereby exploiting the economic advantages of agglomeration and accelerating the local economy to grow at a faster rate. As a result, the scope of administrative management and the resources that can be allocated in an administrative region are an important component of administrative region potential, which includes the size of the labor force, capital, jurisdiction and land resources of the administrative region.

    Referring to the derivation process of equation (5), the potential energy of factor of production i of an administrative region and the total potential of the dimension can be obtained as follows:

    ${{S}_{jt}}=\frac{{{h}_{jt}}p_{at}^{-1}}{\alpha {{h}_{jt}}p_{at}^{-1}+{{k}_{jt~}}p_{bt}^{-1}}$.
    ${{S}_{t}}=\underset{i=1}{\overset{\text{n}}{\mathop \prod }}\,{{\left( \frac{{{h}_{jt}}p_{at}^{-1}}{\alpha {{h}_{jt}}p_{at}^{-1}+{{k}_{jt}}p_{bt}^{-1}} \right)}^{{{w}_{j}}}}$.

    where Sjt is the potential of factor of production j in year t; St is the potential S of administrative region A in year t; pat is the population size of administrative region A in year t; pbt is the population size of region B in year t; and hit and kit are the values of factor of production i in administrative region A and region B, respectively. wj is the weight of j factor. α is the adjustment coefficient, and when h $\in$ k, α = 0, but when h is independent of k, α = 1. Substituting equations (5) and (6) for (1), the equation for measuring total administrative region potential is as follows:

    $P{{T}_{t}}=f\left( {{S}_{\text{it}}},{{Q}_{\text{jt}}} \right)=\underset{i,j=1}{\overset{\text{n}}{\mathop \prod }}\,{{\left( \frac{{{u}_{it}}p_{at}^{-1}}{\alpha {{u}_{it}}p_{at}^{-1}+{{v}_{it}}p_{bt}^{-1}} \right)}^{{{\text{w}}_{\text{i}}}}}\text{*}{{\left( \frac{{{h}_{jt}}p_{at}^{-1}}{\alpha {{h}_{jt}}P_{at}^{-1}+{{k}_{jt}}p_{bt}^{-1}} \right)}^{{{\text{w}}_{\text{j}}}}}$

    Assuming that all indicators are placed together to calculate weights, and under normal conditions α = 0, equation (9) can be abbreviated as,

    $P{{T}_{t}}=\underset{i=1}{\overset{\text{n}}{\mathop \prod }}\,{{\left( \frac{{{x}_{it}}{{p}_{bt}}}{{{y}_{it}}{{p}_{at}}} \right)}^{{{w}_{i}}}}$.

    where PTt refers to the potential of administrative region A in year t; pbt is the population size of region B in year t; pat is the population size of administrative region A in year t; xit and yit represent the value of any constituent factors of production i for administrative region A and region B, respectively.

    3 Research method

    3.1 Research area

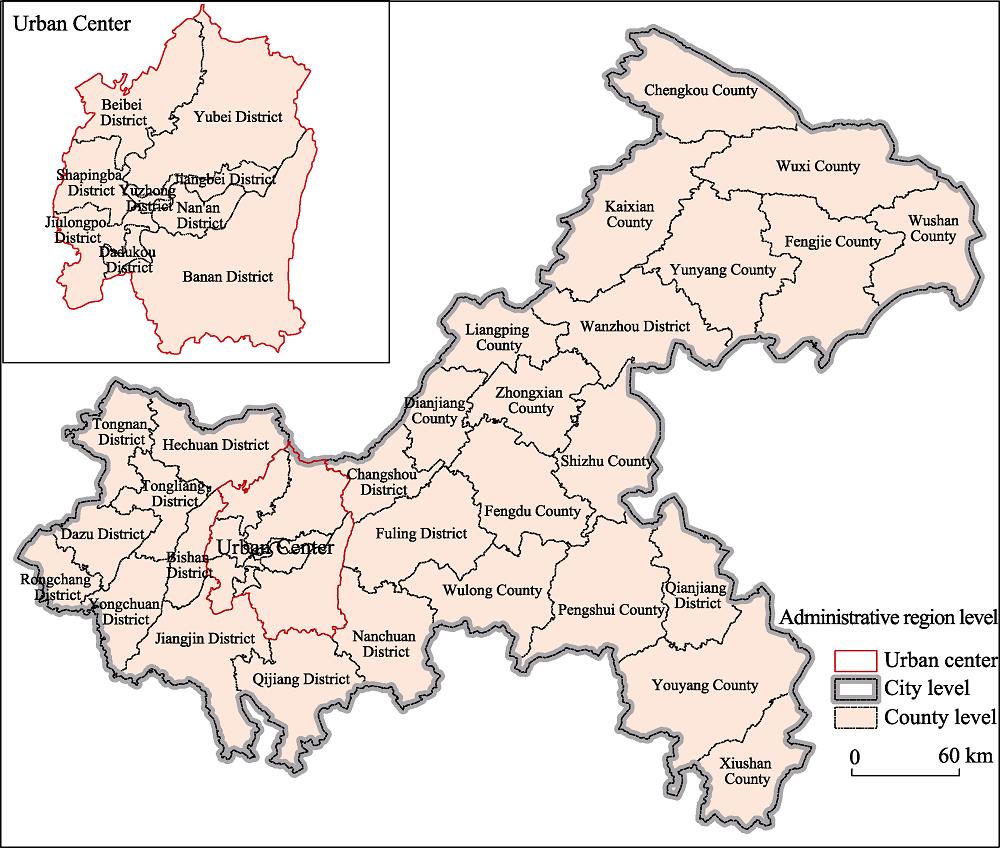
    Chongqing is a national central city and municipality directly under the jurisdiction of Chinese central government. It provides strategic support to the West China Development program and is the western central hub of the Yangtze River Economic Belt. Chongqing has always occupied an important position in China's land development structure. After the founding of the People's Republic of China in 1949, Chongqing was a municipality directly under the Central Government. In 1964, Chongqing became a core city in the Third Front Movement. In 1983, the CPC Central Committee and the State Council formulated a separate plan for Chongqing, giving it provincial economic management authority. After 1984, Chongqing Municipality frequently carried out its administrative division adjustments (Figure 1 and Table 1).

    Map showing Chongqing's administrative division

    Figure 1.Map showing Chongqing's administrative division

    DateAdministrative division adjustment content
    Mar-Aug 1992The three counties of Yongchuan County, Jiangjin County and Hechuan County were redesignated as cities and incorporated into Chongqing Municipality.
    Mar 1, 1995Chongqing Municipality's previous 9 municipal districts, 3 county-level cities and 9 counties were adjusted into 11 municipal districts, 3 county-level cities and 7 counties, expanding the administrative regions of the Central District, Jiangbei District, Nan'an District, Shapingba District, Jiulongpo District, Dadukou District and Beibei District. Baxian County and Jiangbei County were abolished, and Banan District and Yubei District were established. After the adjusting these districts, Chongqing's main urban area increased from 931.1 km2 to 5472.8 km2 (Xinhuanet, 2009).
    Sep 15, 1996Central government approves incorporating Wanxian City, Fuling City and Qianjiang District into Chongqing Municipality.
    Jun 18, 1997Chongqing upgraded to become the fourth municipality directly under the central government in China.
    Dec 20, 1998Chongqing Municipality abolished Wanxian City and its jurisdictions of Longbao, Tiancheng and Wuqiao districts, and established Wanzhou District and set up Wanzhou Immigration Development Zone. It also abolished Fuling City, Zhicheng District and Lidu District, and established Fuling District.
    Dec 25, 2001Changshou County redesignated as Changshou District.
    Oct 22, 2006Jiangjin, Hechuan, Yongchuan and Nanchuan cities were redesignated as municipal districts, significantly increasing the area of built-up municipal districts that year.
    Oct 27, 2011Wansheng District and Qijiang County were abolished, and Qijiang District and Wansheng Economic and Technological Development Zone were established; Shuangqiao District and Dazu County were abolished, and Dazu District and Shuangqiao Economic and Technological Development Zone were established.
    May 2, 2014Tongliang and Daishan counties were redesignated as municipal districts, giving Chongqing jurisdiction over a total of 21 municipal districts, 13 counties and 4 autonomous counties.

    Table 1.

    The administrative division adjustments of Chongqing from 1984 to 2014

    According to available data, Chongqing's economic development has achieved remarkable results. Between 1984 and 2014, Chongqing's GDP went from 14.16 billion yuan to 1.43 trillion yuan in 2014, increasing by a factor of 99.69, while per capita GDP rose from 542 yuan to 47,850 yuan, increasing by a factor of 87.28. Chongqing's GDP as a proportion of national GDP increased from 1.97% to 2.21% during the same period, while its per capita GDP as a ratio of national per capita GDP rose from 0.78 to 1.01 and as a ratio of Sichuan's per capita GDP, from 1.11 to 1.36, indicating that Chongqing's economic growth rate was faster than the whole country and other administrative regions in its surrounding area (Figure 2). This may be related to a series of reform experiments, such as administrative division adjustments and management systems of Chongqing Municipality. This makes Chongqing a suitable research area for measuring changes in administrative region potential and their impact on local economic performance. Moreover, as a provincial-level administrative region, Chongqing has relatively complete statistical data. To avoid any interference effect of the central government's policy of Chongqing being specially designated in the state plan in 1983, the study period selected is from 1984 to 2014.

    Change in Chongqing's GDP and its ratio of national GDP 1984-2014 [GDP (hundreds of millions yuan)/ratio/GDP (hundreds of millions yuan), per capita GDP ratio, ratio of Chongqing per capita GDP to Sichuan per capita GDP]

    Figure 2.Change in Chongqing's GDP and its ratio of national GDP 1984-2014 [GDP (hundreds of millions yuan)/ratio/GDP (hundreds of millions yuan), per capita GDP ratio, ratio of Chongqing per capita GDP to Sichuan per capita GDP]

    3.2 Selecting and measuring variables

    3.2.1 Local economic development performance (dependent variable)

    The variables that measure the performance of local economic development are usually local GDP growth or per capita GDP growth, which represent the absolute speed of local economic development. However, at present, China's economy is still in a period of medium-to-high-speed growth, and regardless of whether administrative divisions are adjusted, the economy still develops, so it is problematic to use these variables as explanatory variables of administrative region potential. Based on the concept of administrative region potential, this paper draws on the research of Chen (2006) and uses a relative indicator to measure change in economic status. The ratio of per capita GDP of the administrative region to national per capita GDP (hereinafter referred to as the per capita GDP ratio) is used to represent local economic performance.

    3.2.2 Administrative region potential

    (1) Proportion of construction land resources in the administrative region. This mainly reflects the power of an administrative region to control the allocation of land resources. Land resources, especially construction land resources, are the basic material resources for urban development. Because the development of urban secondary and tertiary industries and economic output is mainly on construction land, construction land area is an important factor affecting the GDP growth of an administrative region. Calculating an administrative region's construction land area as a proportion of national construction land area reflects the administrative region's share and relative advantage of national land resources. Due to a lack of data on Chongqing's urban construction land area before 1999, construction land under Chongqing's jurisdiction is measured by determining the built-up area of Chongqing's municipal districts as a proportion of the built-up area of all China's municipal districts.

    (2) Ratio of human capital. Population factors affect economic development, and human capital is a positive factor in local economic output. There are many indicators that measure human capital. This paper uses the number of students in colleges and universities as the proxy variable for human capital (Shen et al., 2007). The human capital ratio is the ratio of college students per 10,000 people in the administrative region to the number of college students per 10,000 people nationally.

    (3) Ratio of fixed-asset investment. Fixed asset investment is an important variable in China's economic growth (Song, 2011). Since there is no central government data on fixed-asset investment in Chongqing before 1997, this study borrows on the fiscal decentralization measurement method and measures the central government's investment in local development by calculating local fixed-asset investment as a proportion of total local and central investment in fixed assets. This indicator is actually similar to fiscal transfer payments, which characterizes the local share of central budgetary allocations.

    (4) Fiscal decentralization. Fiscal decentralization theory emphasizes the scale of financial resources that local governments have to allocate. Fiscal decentralization is measured as the share of local fiscal expenditure over central and local fiscal expenditures. This indicator is widely used in current domestic research (Wang et al., 2007). It measures the expenditure responsibilities of local governments and the size of their allocated and used financial resources compared to the central government. Previous studies have shown that this indicator is positively correlated with China's economic growth (Zhou et al., 2008).

    (5) Administrative decentralization. The degree of decentralization of local administrative management is measured by the number of employees in public administration and social organizations in an administrative region as a proportion of the number of employees in public administration and social organizations nationwide. The more civil servants there are in Chongqing, the fewer people they administer and govern at the same size, which means that administrative power is greater and the government's administrative management and decision-making power is greater (Gong et al., 1998; Chen et al., 2010).

    To eliminate the effect of an administrative region's population size, this paper uses per capita indicators. To eliminate the effect of economic scale, with the exception of the per capita GDP ratio, indicators are deflated using the adjustment factor [1-(GDPt/TGDPt)]. The specific equations for measuring indicators are shown in Table 2. For the aforementioned indicators, data relevant to Chongqing is taken from the Chongqing Statistical Yearbook (1989-2015) and China Urban Statistical Yearbook (1985-2015). National statistical data is from China Statistical Yearbook (1985-2015).

    ElementIndicatorEquationMeaning of variables
    Dependent variablePer capita GDP ratio (AGP)$AG{{P}_{t}}=\frac{GD{{P}_{t}}/PO{{P}_{t}}}{TGD{{P}_{t}}/TPO{{P}_{t}}}$. (11).GDPt: local GDP in year tTGDPt: GDP in year tPOPt: permanent population of Chongqing in year tTPOPt: permanent population of China in year t
    SConstruction land area (LP)$L{{P}_{t}}=\frac{B{{A}_{t}}/PO{{P}_{t}}}{TB{{A}_{t}}/TPO{{P}_{t}}}\text{*}\left( 1-\frac{GD{{P}_{t}}}{TGD{{P}_{t}}} \right)$. (12-1).BAt: built-up area of the administrative region in year tTBAt: total built-up area in nationwide urban areas in year t
    Human capital ratio (HCP)$HC{{P}_{t}}=\frac{C{{S}_{t}}/PO{{P}_{t}}\text{*}10000}{TC{{S}_{t}}/TPO{{P}_{t}}\text{*}10000}\text{*}\left( 1-\frac{GD{{P}_{t}}}{TGD{{P}_{t}}} \right)$. (12-2).CSt: number of local college students in year tTCSt:: number of college students nationwide in year t
    Fixed-asset investment ratio (FTP)$FT{{P}_{t}}=\frac{F{{S}_{t}}/PO{{P}_{t}}}{TF{{S}_{t}}/TPO{{P}_{t}}}\text{*}\left( 1-\frac{GD{{P}_{t}}}{TGD{{P}_{t}}} \right).$ (12-3).FIt: local fixed-asset investment in year tTFIt:: national fixed-asset investment in year t
    QFiscal decentralization of admin region (FD)$F{{D}_{t}}=\frac{F{{S}_{t}}/PO{{P}_{t}}}{F{{S}_{t}}/PO{{P}_{t}}+CGF{{S}_{t}}/TPO{{P}_{t}}}\text{*}(1-\frac{GD{{P}_{t}}}{TGD{{P}_{t}}})$. (12-4).FSt: local fiscal expenditure in year tCGFSt: central fiscal expenditure in year tGDPt: GRP in year tTGDPt: GDP in year t
    Local administrative decentralization (AD)$A{{D}_{t}}=\frac{P{{S}_{t}}/PO{{P}_{t}}*10000}{TP{{S}_{t}}/TPO{{P}_{t}}*10000}\text{*}\left( 1-\frac{GD{{P}_{t}}}{TGD{{P}_{t}}} \right).$ (12-5).PSt: number of local public administration and social organization workers in year tTPSt:: number of national local public administration and social organization workers in year t

    Table 2.

    Equations for measuring administrative region potential indicators

    3.3 Multi-variable measurement model

    In accordance with equation (1), this study uses the weighted produ method to integrate the five variables and obtain an equation for measuring administrative region potential:

    $P{{T}_{t}}=L{{P}_{t}}^{{{w}_{1}}}\text{*}F{{D}_{t}}^{{{w}_{2}}}\text{*}A{{D}_{t}}^{{{w}_{3}}}\text{*}FI{{P}_{t}}^{{{w}_{4}}}\text{*}HC{{P}_{t}}^{{{w}_{5}}}$

    where PTt represents administrative region potential in year t. Explanations of the other variables are given in Table 2. In general, 0<PT<1, and the closer the PT value to 1, the greater the administrative region potential. The advantage of this model is that it can reflect changes in administrative region potential caused by administrative division adjustment. If an administrative division adjustment causes an increase in potential, it is considered to have had a positive effect. If it causes a decrease in potential, the administrative division adjustment is considered to have had a negative effect.

    Principal component analysis (PCA) is a common method for weighting coefficients and is used to determine the weight of each variable. The procedure for calculating this is as follows: Firstly, statistical software SPSS21.0 is used to calculate a principal component matrix for the five variables. The results obtained two principal components, with eigenvalues 3.443 and 1.018, and variance contribution rates of 68.851% and 20.356%. Secondly, the coefficients of each variable in the linear combination of the two principal components are calculated separately. The calculation formula is ${{C}_{ij}}/\sqrt{{{E}_{i}}},$ where Cij is the principal component coefficient of indicator j of principal component i, and Ei represents the eigenvalue of principal component i. Next, by combining the linear combination coefficients of the two principal components, the comprehensive score of each variable can be obtained. The formula is $\underset{i=1}{\overset{2}{\mathop \sum }}\,{{C}_{ij}}*{{V}_{i}}/\underset{i=1}{\overset{2}{\mathop \sum }}\,{{V}_{i}},$ where Vi represents the variance contribution rate (%) of principal component i. Finally, the indicators are normalized to calculate the weight coefficients of variables land jurisdiction, fixed-asset investment ratio, human capital ratio, fiscal decentralization and administrative decentralization, which are 0.2244, 0.1961, 0.1657, 0.2240, and 0.1898, respectively. These can then be used to obtain the equation for calculating administrative region potential:

    $P{{T}_{i}}=L{{P}_{i}}^{0.2244}\text{*}F{{D}_{i}}^{0.2240}\text{*}A{{D}_{i}}^{0.1898}\text{*}FI{{P}_{i}}^{0.1961}+HC{{P}_{i}}^{0.1657}.$

    3.4 Empirical test of the potential model

    To test the desirability and applicability of the administrative region potential model, an empirical test is carried out on the relationship between the administrative region potential of Chongqing Municipality (PT) and the per capita GDP ratio (Y). This study uses the E-G two-step cointegration model to test whether Y and PT have a long-term stable relationship. In the first step, a linear regression model, Yt, of variable Y and independent variable PT is constructed, and a common OLS method is used to estimate the coefficients of the cointegration equation, giving the cointegration relationship between Y and independent variables. In the second step, the Augmented Dickey-Fuller (ADF) unit root test is carried out on the residual sequence of the equation.

    ${{Y}_{t}}={{\beta }_{0}}+{{\beta }_{1}}P{{T}_{t}}+{{\varepsilon }_{t}}$

    To further determine the robustness of the positive effect of administrative region potential on the per capita GDP ratio, this paper adds new factors to the composition of administrative region potential, but factors that affect local economic development are other control variables, used to re-estimate the model coefficients. The following are control factors:

    (1) Level of urbanization. Level of urbanization is an important variable in promoting economic development (Zhao et al., 2006). The higher the level of urbanization, the higher the per capita GDP level. Due to a lack of statistics on the level of urbanization in Chongqing before 1996, this paper uses the non-agricultural permanent population rate of Chongqing as the proxy variable for urbanization level.

    (2) Overseas exports. The level of overseas exports reflects the city's degree of dependence on foreign trade. In macroeconomic theory, exports are considered an import variable in economic growth. This paper uses Chongqing's per capita foreign exports as a proportion of national per capita GDP as the controlling variable affecting per capita GDP ratio.

    (3) Employment rate. Employment rate is another important factor in promoting economic development. The employment rate of Chongqing is given as the ratio of Chongqing's employment rate to the national employment rate. To eliminate the impact of economic scale, the reduction factor [1-(GDPi/TGDPi)] is used to deflate the level of urban overseas exports and employment level.

    (4) Other policy support factors. The policy preferences of China's central government are a common factor affecting local economic development. Given that implementation of the West China Development program by the central government in 2000 may have had an impact on Chongqing's economic development, this factor is included as a dummy variable in the model.

    When control variables are considered, the equation is as shown in equation (16), and where t<2000 and the West China Development program is not implemented, Dt=0, t≥2000, Dt=1.

    ${{Y}_{t}}={{\beta }_{0}}+{{\beta }_{1}}P{{T}_{t}}+{{\beta }_{2}}U{{R}_{t}}+{{\beta }_{3}}A{{E}_{t}}+{{\beta }_{4}}E{{L}_{t}}+{{\beta }_{5}}{{D}_{t}}P{{S}_{t}}+{{\varepsilon }_{t}}$

    After Chongqing became a municipality directly under the central government, not only did its area of jurisdiction and population expansion, but because it was elevated to the level of a provincial administrative region, its fiscal powers and general authority increased, and direct investment by the central government also increased. It is assumed that, after administrative division adjustments, administrative region potential will have a more significant impact on the growth of per capita GDP ratio. In order to test this effect, the virtual variable of administrative division adjustment is introduced to the equation by addition and multiplication (α1Dt2DtPTt) to give equation (17):

    ${{Y}_{t}}={{\beta }_{0}}+{{\beta }_{1}}P{{T}_{t}}+{{\alpha }_{1}}{{D}_{t}}+{{\alpha }_{2}}{{D}_{t}}P{{T}_{t}}+{{\varepsilon }_{t}}$

    It should be acknowledged that although Chongqing officially became a municipality directly under the central government in 1997, the number of municipal districts in Chongqing increased significantly in 1995, which increased its area of jurisdiction and its administrative region potential accordingly. As a result, it is assumed that 1995 is the inflection point of the effect of administrative region potential on the per capita GDP ratio; that is, when t<1995, development is not affected by administrative division adjustment, so Dt=0, but when t≥1995, it is affected by adjustments, so Dt= 1. Equation (17) is primarily used to reflect the positive impact of administrative division adjustment on increasing per capita GDP ratio.

    4 Results and analysis

    4.1 Results of Chongqing's administrative region potential

    Using the formulas listed in Table 2, values were calculated for Chongqing's land jurisdiction, fixed-asset investment ratio, human capital, fiscal decentralization and administrative decentralization during the period 1984-2014 (Figure 3). It was discovered that in 1995, 1998, 2006 and 2011, there were significant increases in Chongqing's area of jurisdiction. These were due to the administrative divisions of Chongqing undergoing major adjustments in these years, as well as subsequent increases in the jurisdiction area of the city. For example, on October 22, 2006, Chongqing Municipality redesignated county-level cities as municipal districts, and in 2011, it redesignated counties as municipal districts, both of which significantly increased Chongqing's built-up area (Table 1). Although Chongqing's area of administrative jurisdiction increased in 1996, Wanxian City, Fuling City and Qianzhang District did not belong to the municipal jurisdiction, so the urban built-up area did not increase significantly. Although there was no administrative division adjustment in 2002, because the 2001 policy to reclassify counties as municipal districts was completed at the end of the year, the results did not show up in the statistical data until 2002. This illustrates that administrative division adjustments led to rapid increases in the built-up area under the jurisdiction of Chongqing Municipality, which dramatically increased jurisdiction over urban construction land.

    Administrative potential indicator values for Chongqing 1984-2014

    Figure 3.Administrative potential indicator values for Chongqing 1984-2014

    Administrative decentralization increased significantly in 1996. This was mainly due to the expansion of the administrative region of Chongqing in 1996, which led to a significant increase in public administration and social organizations. In the other years, administrative decentralization remained basically stable. The level of human capital showed an upward trend between 1984 and 1996, and it first declined and then increased between 1997 and 2014. The degree of fiscal decentralization showed steady growth over the research period, indicating that after being specially designated in the state plan in 1983 and after becoming a municipality directly under the central government in 1997, the central government steadily increased Chongqing's fiscal autonomy.

    Having used the AGP calculation equation and equation (1) in Table 2 to calculate the per capita GDP ratio and the combined administrative region potential of the five indicators, as well as a line graph to chart the evolution of the two variables (Figure 4), it was discovered that although the administrative region potential of Chongqing increased slightly from 1984 to 1994, the overall change was not large, so the curve is relatively flat. Since 1995, the growth rate of Chongqing's administrative region potential has accelerated significantly. After Chongqing was governed directly under the central government in 1997, administrative region potential also increased significantly, and it continued to increase rapidly thereafter. The data shows that the average annual growth rate of administrative region potential between 1984 and 1994 was just 0.45%; whereas, the average annual growth rate between 1995 and 2014 was 3.3%. From 1984 to 2014, Chongqing's per capita GDP ratio also showed steady growth, with a sharp jump between 1995 and 1997 and faster growth there- after. Average annual growth of per capita GDP ratio in the period 1984-1994 was -0.67%, and 1.72% in the period 1995-2014.

    Overall administrative region potential of Chongqing 1984-2014[Chongqing's administrative region potential/per capita GDP status//year//Chongqing's administrative region potential (X)/Chongqing's per capita GDP status (Y)]

    Figure 4.Overall administrative region potential of Chongqing 1984-2014[Chongqing's administrative region potential/per capita GDP status//year//Chongqing's administrative region potential (X)/Chongqing's per capita GDP status (Y)]

    4.2 Analysis of the effect of Chongqing's administrative region potential

    To avoid spurious regression, the ADF unit root test is performed on the dependent variable and all independent variables. The test results show (see Table 3) that the ADF associated probability of administrative region potential, per capita GDP ratio, per capita foreign exports, non-agricultural population rate and employment level is significant at or below the 1% level, indicating that the five variables change into a stationary sequence after first-order difference; that is, the five variables are a first-order single-integer sequence.

    SequenceADF test statistical valueProb.OrderMethodConclusion
    Administrative region potential-4.6940.0041Trend and interceptStable
    Per capita GDP ratio-5.6790.0001Trend and interceptStable
    Per capita foreign exports-6.8370.0001Trend and interceptStable
    Non-agricultural population rate-5.3790.0011Trend and interceptStable
    Employment level-4.4870.0091Trend and interceptStable

    Table 3.

    Results of the unit root test of variables

    The E-G two-step method is used to test the cointegration relationship between variable Y and administrative region potential. The first step is to examine the impact of administrative region potential on the per capita GDP ratio of Chongqing. A common OLS method is used to estimate equation (15). The results show that the positive effect coefficient of administrative region potential on per capita GDP ratio is 0.665, significant at P<0.001, indicating that administrative region potential has a significant positive effect on improving economic performance, such as per capita GDP ratio. After adjustment, the R2 value is greater than 0.9, indicating that the equation (18) fits well.

    ${{Y}_{t}}=0.431+0.665P{{T}_{t}}$

    R2=0.908, R2adjusted=0.904, DW=0.891, F=284.91

    Afterward, the ADF test is performed on the residual sequence of the equation. The test method selected is horizontal state, as it does not contain a time trend or constant term. The result shows that the ADF statistic value is -3.876 (P < 0.001), indicating that the residual sequence rejects the null hypothesis with a significance level of 1%, meaning an acceptance of the conclusion of no unit root. It shows that there is a long-term cointegration relationship between administrative region potential and per capita GDP ratio. The regression coefficient of the equation represents elasticity between variable Y and PT. That is, for every 1 percentage point increase in administrative region potential, the per capita GDP ratio increases by 0.726 percentage points. The promotion effect of administrative region potential on per capita GDP ratio is thus very evident.

    The preceding analysis confirms the positive effect of administrative region potential on per capita GDP, but it is still unconfirmable whether this positive effect is as robust in the presence of other variables. Therefore, the OLS method has been used to estimate equation (16) with the control variables of urbanization level, per capita foreign exports and regional preferential policies added. The results show (Table 4) that after the inclusion of control factors, Chongqing's administrative region potential still has a significantly positive effect on increasing the per capita GDP ratio, with a regression coefficient of 0.604 and probability of P < 0.001. The non-agricultural population and the Western China Development program do not have a significant effect on the per capita GDP ratio (P=0.969, P=0.136); per capita foreign exports has a positive effect on increasing the per capita GDP ratio (β=0.107, P=0.005); employment level has a negative effect on increasing the per capita GDP ratio, indicating that it is difficult to use this indicator to explain increases in per capita GDP ratio. The estimation results of equation (16) show that the positive effect of administrative region potential on per capita GDP is significant and stable.

    VariableCoefficientStd. errort-StatisticProb
    Constant term0.6090.05211.7170.000
    Administrative region potential0.6040.1105.4770.000
    Non-agricultural population-0.0090.218-0.0400.969
    Per capita foreign exports0.1070.0353.0510.005
    WCD program*administrative region potential-0.0410.027-1.5410.136
    Employment level-0.1670.040-4.2030.000
    R2=0.963 Adjusted R2 =0.956 F=131.583 DW=1.404

    Table 4.

    Equation (16) parameter estimation results

    It can be seen that since 1995, the growth trajectory of administrative region potential has undergone significant changes (Figure 3). It can be inferred, then, that after 1995, the per capita GDP ratio also accelerated accordingly. This hypothesis can be tested using equation (18) with the administrative division adjustment dummy variable included. The results show that when t<1995, the influence of administrative region potential on the per capita GDP ratio is not significant (β=1.233, P= 0.072), and when t≥1995 (i.e. Dt=1), there is a regression equation (19):

    ${{Y}_{t}}=0.409+1.931P{{T}_{t}}$

    R2=0.930 R2Adjusted=0.922 F=119.36 DW=1.061

    The adjusted R2 value is greater than 0.9, indicating that the equation fits well, and the regression coefficient is 1.023, indicating that after 1995, as Chongqing's administrative region potential increased by 1 percentage point, per capita GDP ratio increased by 1.931 percentage points. This effect is much higher than the effect of administrative region potential on the per capita GDP ratio in Chongqing prior to 1995, and it is also higher than the effect of administrative region potential on per capita GDP ratio overall (β=0.665). This indicates that adjusting administrative divisions changed the growth trajectory of administrative region potential, and it had a more positive effect on economic performance, as represented by the per capita GDP ratio.

    5 Conclusion, discussion and prospects

    5.1 Conclusion

    First, administrative region potential consists of the potential energy created by the two elements of jurisdictional scope and administrative level. Based on a definition of the concept of administrative region potential, this study constructed an administrative region potential measurement model and carried out empirical research on Chongqing Municipality. The results showed that administrative region potential, made up of the five variables of built-up area ratio, local fiscal decentralization, administrative decentralization, fixed-asset investment ratio and human capital ratio, is closely linked with administrative division adjustment in Chongqing, which indicates that an administrative region potential measurement model can objectively and realistically reflect positive changes brought about by administrative division adjustment in Chongqing. The concept and measurement principles of administrative region potential suggest that the government needs to comprehensively examine whether the composite value of variables such as human capital, land area, fiscal power, administrative power and fixed-asset investment can be significantly improved when administrative division adjustment was finished. For example, in the analysis of redesignating counties as municipal districts, from the perspective of the municipal level, integration of urban space and resources increases the construction land area, human capital, fiscal power and fixed-asset investment of the city, which should increase administrative region potential. The counties that have redesignated as municipal districts change from being directly governed by the provincial government to being governed as municipal districts, which actually increases their administrative level and reduces their financial and administrative powers. As such, the measurement formula of this paper can be used to weigh the effects of adjustments to different levels of administrative regions and determine whether redesignating counties as municipal districts will have a positive effect.

    Second, administrative region potential and per capita GDP ratio have a long-term cointegration relationship. The results of this study confirm that there is a long-term stable positive relationship between increased administrative region potential and per capita GDP ratio, and this effect is still stable after adding other control variables, while the influence of other variables is not particularly obvious. This aspect verifies the rationality of the administrative region potential model and shows that administrative region potential is an important reason behind improved local economic performance. In the Chinese administrative management system, to strengthen economic management, higher-level governments have the right to determine local levels of resource development and utilization as well as rights over resource allocations, and they can influence local development through fixed-asset investment, such as construction projects. As a result, the effect on the per capita GDP ratio of market-based variables, such as urbanization level, per capita foreign exports and employment level, are not particularly evident; whereas, human capital, land resources, and various physical capital inputs have an obvious stimulatory effect on local economic performance. This shows that, in the process of adjusting administrative division, the government should pay attention to integrating labor power and land resources, with special attention paid to the overall arrangements of jurisdiction and resource allocation systems, so as to rationalize relationships between upper and lower levels of fiscal powers and general authority and maximize the development potential of local administrative regions.

    Third, reasonable administrative division adjustments are conducive to improving the administrative region potential of a region, and thus have a positive effect on economic performance and output. After its urban area expanded in 1995, the administrative region potential of Chongqing began to grow more quickly, and its per capita GDP ratio also began to increase more quickly. After it officially became a municipality directly under the central government in 1997, Chongqing's administrative level was raised. Such an improvement in administrative status usually leads to greater autonomy, political authority and resource allocation powers. Moreover, raising a place's administrative level and reconfiguring its administrative regions promotes economic development due to the more rational spatial allocation of resources through unified planning and development. This confirms the research conclusions of Wang Hao et al. that administrative level has a positive effect on the development of Chinese cities (Wang et al., 2015). This means that governments at all levels should pay attention to the positive effects of administrative division adjustment based on their social and economic development needs, as it can promote the optimization of a regional structure and resource integration, raise administrative region potential and enhance the competitiveness and development capacity of administrative regions at the same level in regional development.

    5.2 Discussion on the uses of the measurement model

    First, the model can be used to measure the impact of different types of administrative division adjustment on administrative region potential and development. The case study of the administrative region potential of Chongqing mainly focused on the expansion of its administrative region, an upgrade in its administrative level and the reform of its administrative system. In terms of the effect of administrative division adjustment on prefecture- and county-level cities, such as the effect on administrative region potential and economic development of counties being redesignated as cities or municipal districts, the same could be explored from the basic two dimensions and basic elements of administrative region potential. However, extra emphasis should be placed on variable selection. For example, to measure the impact of administrative region upgrades, there are clear changes in the administrative and financial system, and they should be regarded as an important dimension model construction. As another example, after a county is redesignated as a municipal district, its administrative authority, fiscal autonomy and the region's fixed-asset investment in it will change significantly. This should be taken into account in the potential model. Merging administrative regions leads to major changes in human capital and land resources, so regional factors of production should be the focus of measuring indictors. Generally speaking, the administrative region potential discussed in this paper can be used as a benchmark model. With appropriate changes to constituent indicators, it can also be used to measure different types of administrative region adjustment — such as redesignating counties as municipal districts or cities, merging administrative regions and changing relationships of administrative subordination - on local development, giving it a certain level of value for its wider applications.

    Second, the measurement model can reflect the long-term effects of administrative division adjustment. If after administrative divisions are adjusted the administrative region potential grows more quickly, causing a more significant effect on per capita GDP ratio, administrative division adjustment will be thought of more favorably. If, however, after administrative division adjustment there is no significant change in the growth trajectory of administrative region potential and there is no effect on per capita GDP ratio, it means there have been no obvious effects on the administrative division adjustments.

    Third, the model mainly measures the relative advantages of a certain administrative region within national administrative divisions. The measurement model can quantitatively measure sequential variations in administrative region potential based on practical experiences of administrative division adjustments, the resource allocation system of national administrative levels and the Cobb Douglas production function. Calculation results are linked to relative indicators such as the per capita GDP of the administrative region as a ratio of per capita GDP of the administrative region at the next higher level. Relationships with other total GDP and speed of GDP growth indicators as well as other economic and social development indicators have not yet been tested.

    Fourth, the model has certain limitations. Due to the difficulties of quantification, the model does not take into consideration competition between administrative regions. The theory of regional competition and cooperation shows that cooperation between administrative regions creates synergy and promotes common development; whereas, competition causes depletion and curbs development of administrative regions. Another limitation is that the model does not take into consideration local administrative costs. In reality, local administrative costs are an important part of administrative region potential. The higher the administrative costs, the greater the depletion of administrative regions, and the lower the administrative region potential; whereas, if administrative costs are reduced, administrative region potential will increase, which is conducive to local development. But because data on administrative costs is not available, it is difficult to incorporate this factor into the empirical measurement model. The third limitation is the availability of data, which meant that the indicators for measuring administrative region potential involved some indirect methods. For example, due to the lack of data on central transfer payments, fiscal decentralization is difficult to measure directly, so the fiscal decentralization formula in Table 2 was used, the results of which serve as a proxy variable for local fiscal decentralization.

    5.3 Research prospects

    As an exploratory study, this paper first selected the provincial-level administrative region of Chongqing as a case study to conduct an empirical test. To apply it to administrative region potential under various administrative division adjustment scenarios at different levels, further research is needed to refine the administrative region potential theory. Even to apply it to an administrative region at the same level, the variables of the administrative region potential measurement formula would need to be adjusted accordingly to the particular circumstances of the administrative region. For example, for resource-based cities, resources would be an important consideration, and for industrial cities, secondary industry would be an important factor. In general, the administrative region potential measurement model can explain relatively well the impact of administrative division adjustment on the economic development. In terms of theory construction and method measurement, it is a good exploration and innovation for enriching and improving research on administrative division. Future research should revise and improve the theory and measurement model of administrative region potential, and typical case studies should be selected for verification, thereby consolidating the theoretical basis of research on China's administrative division.

    References

    [1] Does the reform of ‘county directly administrated by province’ damage the city’s interests?. Economic Research, 65-77(2011).

    [2] The gravitational potential energy is indeed related to quality and height: Correcting the mistakes in the paper of “thinking on the different factors affecting gravitational potential energy”. Chinese Journal of Physics, 36, 111-114(2017).

    [3] Tax-share reform, local fiscal autonomy, and public goods provision. China Economic Quarterly, 9, 1427-1446(2010).

    [4] Relative location potential analysis of SUB-CBD Development.. Journal of Systems & Management, 9, 321-325(2000).

    [5] On the regional economic effects about adjustment of administrative regions at prefecture level: A case study of Sichuan province. Economic Geography, 26, 418-421(2006).

    [6] A study on the mode and development mechanism of the port locational potential. Journal of Systems & Management, 15, 215-219(2006).

    [7] Challenges of creating cities in China: Lessons from a short-lived county-to-city upgrading policy. Journal of Comparative Economics, 40, 476-491(2012).

    [8] How does adjustment of the administrative regions affect the regional economic growth: Evidence from the adjustment of administrative at prefecture-level cities and above. Economic System Reform, 66-71(2015).

    [9] The quantitively measurement of Chinese-style fiscal decentralization. Statistical Research, 27, 47-55(2010).

    [10] . Urbanization in China: Policy issues and options.(2019). http://www.econ.brown.edu/Faculty/henderson/FinalFinalReport-2007050221.pdf

    [11] On performance analysis of turning country into district in Panyu, Guangzhou. Human Geography, 22, 111-114(2007).

    [12] On the “development mode” of Chinese urbanization. Social Sciences in China, 82-100(2012).

    [13] Fiscal decentralization and economic growth in China. Economic Development and Cultural Change, 49, 1-21(2000).

    [14] Perspective of the “administrative region economy” phenomenon in China’s transitional period: An introduction of human-economic geography with Chinese characteristics. Economic Geography, 26, 897-901(2006).

    [15] Introduction. In: Liu W D et al. Regional Development Report of China (2013). Beijing: The Commercial Press:, 1-19(2014).

    [16] Change characteristics and trends of urban administrative division in China since its reform and opening-up. Urban Problems, 77-82(2008).

    [17] Study on the basic problems and reform of Chinese administration division. Chinese Public Administration, 41-43(2009).

    [18] Location potential and its BCM estimating model. Ecological Economy, 32-34(2006).

    [19] Port locational potential evaluation and development strategy of Zhoushan Islands New District: Based on empirical analysis of Zhoushan, Ningbo and Shanghai Port Locational Potential. Economic Geography, 33, 114-118(2013).

    [20] Federalism and the soft budget constraint. American Economic Review, 88, 1143-1162(1998).

    [21] Federalism as a commitment to preserving market incentives. Journal of Economic Perspectives, 11, 83-92(1997).

    [22] et alThe impacts of administrative district adjustment on the evolution of urban spatial structure: A case of Huai’an and Jiangsu Province. Economic Geography, 35, 61-67(2015).

    [23] The relationship between China’s decentralized system in finance and her regional economic growth. Management World, 2005, 31-39(2005).

    [24] Regional decentralization and economic efficiency: Evidence from separate-planning cities in China. Economic Research, 17-28(2007).

    [25] Retesting the relationship between fixed asset investment and economic growth in China from 1980 to 2010. Macroeconomic Study, 17-21(2011).

    [26] Administrative boundary adjustment and urbanization of population: Evidence from city-county merger in China. Economic Research, 72-85(2015).

    [27] The administrative division adjustment of big cities in China: Taking administrative division adjustment in Guangzhou city in recent years as an example. Urban Problems, 70-75(2006).

    [28] Financial decentralization, local government behavior and regional economic growth. Economic Theory and Business Management, 60-64(2007).

    [29] Administrative division adjustment and economic growth. Management World, 42-53(2010).

    [30] et alNatural conditions, administrative level and China’s urban development. Management World, 41-50(2015).

    [31] History of Chongqing (1949-2008)(2017). http://www.cq.xinhuanet.com/2009/2009-09/01/ content_17568619_1.htm

    [32] Administrative adjustment of Xinjiang in multiple perspectives. Acta Geographica Sinica, 68, 1367-1379(2013).

    [33] et alA study on tourism effect of adjustment of administrative demarcation: Giving consideration to comparison of the tourism effect of adjustment of administrative demarcation between Huangshan City and Jinggangshan City. Scientia Geographica Sinica, 26, 20-25(2006).

    [34] A dynamic analysis of the interaction between urbanization and economic development in China. China Soft Science, 116-121(2006).

    [35] The role of gravitational potential energy in raising and spreading of Qinghai-Xizang Plateau. Chinese Journal of Geophysics-Chinese Edition, 45, 226-232(2002).

    [36] Financial decentralization, economic growth and fluctuations. Management World, 6-15(2008).

    Kaiyong WANG, Fuyuan WANG. Theory and measurement model of administrative region potential from a perspective of administrative division adjustment: Taking Chongqing city as a case study[J]. Journal of Geographical Sciences, 2020, 30(8): 1341
    Download Citation