
Igor S. Balashov, Alexander A. Chezhegov, Artem S. Chizhov, Andrey A. Grunin, Konstantin V. Anokhin, Andrey A. Fedyanin. Light-stimulated adaptive artificial synapse based on nanocrystalline metal-oxide film[J]. Opto-Electronic Science, 2023, 2(10): 230016
- Opto-Electronic Science
- Vol. 2, Issue 10, 230016 (2023)
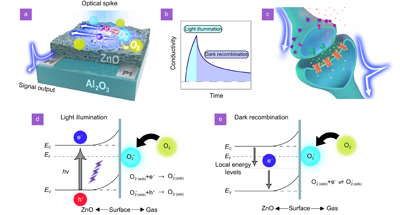
Fig. 1. (a ) 3D schematic illustration of light-stimulated artificial synapse based on nanocrystalline ZnO film. (b ) Postsynaptic conductivity modulation induced by light. (c ) 3D schematic illustration of a biological synapse. (d , e ) Energy level diagrams of an optoelectronic synapse for light stimulation and dark electrons recombination.
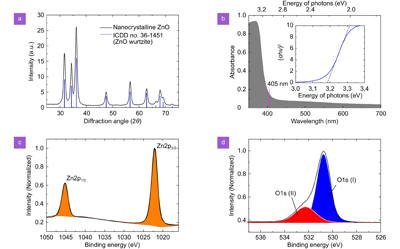
Fig. 2. Nanocrystalline ZnO characterization. (a ) X-ray diffraction pattern. (b ) UV-vis absorbance spectrum, the inset is determination of Eg of nanocrystalline ZnO from optical absorption using a Tauc plot. (c ,d ) X-ray photoelectron spectra on the Zn2p (c) and O1s (d) regions.
Fig. 3. (a ) Optical microscopy images of Al2O3 substrate with Pt electrodes and (b ) covered with ZnO layer. Scanning electron microscopy images: (c ) the edge of ZnO layer obtained as the sample is tilted by 70° to measure its thickness; (d ) the ZnO layer surface; (e ) individual aggregates forming a ZnO layer.
Fig. 4. Basic neuromorphic photoelectric properties. (a ) Postsynaptic conductivity (black curve) for four pre-synaptic light pulses lasting 25 seconds with 50% duty cycle (purple). (b ) Postsynaptic conductivity after 1200 seconds light exposure and dark conductivity decay approximation. (c ) STM-to-LTM transition emerging by frequency increase. (d ) PPF index defined as the ratio of the amplitude B1 of the response to the first light pulse the amplitude B2 corresponding to the second spike plotted as a function of time delay between two spikes.
Fig. 5. Adaptation studies. (a ) 100 light-pulses sequential irradiation for four conductivity change ranges, 2-hour continuous illumination of ZnO-based synapse (gray dashed curve). (b ) Logarithmic dependence of illumination duration for each of 100 pulses. (c ) Logarithmic dependence of the relaxation after each of 100 pulses.
Fig. 6. Spike frequency as a function of spike number for different conductivity change ranges.
Fig. 7. Integration of light-stimulated synapses with adaptation properties into computing platform. In the simplest way, the final artificial neuron firing rate is determined by its presynaptic inputs selectivity. The graph shows two types of response: S1 corresponds to a neuron without synaptic inputs adaptation, S2 is a response of a neuron with adaptation.

Set citation alerts for the article
Please enter your email address
© Copyright 2018-2021 | Chinese Laser Press. All Rights Reserved 沪ICP备15018463号-20