• Photonics Research
  • Vol. 10, Issue 1, 189 (2022)
Huwei Ni1、†, Yalun Wang2、†, Tao Tang3, Wenbin Yu1, Dongyu Li4, Mubin He1, Runze Chen1, Mingxi Zhang3、5、*, and Jun Qian1、6、*
Author Affiliations
  • 1State Key Laboratory of Modern Optical Instrumentations, Centre for Optical and Electromagnetic Research, College of Optical Science and Engineering, International Research Center for Advanced Photonics, Zhejiang University, Hangzhou 310058, China
  • 2SIEE (Sussex AI Institute), Zhejiang Gongshang University, Hangzhou 310018, China
  • 3State Key Laboratory of Advanced Technology for Materials Synthesis and Processing, Wuhan University of Technology, Wuhan 430070, China
  • 4Britton Chance Center for Biomedical Photonics, Wuhan National Laboratory for Optoelectronics, Huazhong University of Science and Technology, Wuhan 430074, China
  • 5e-mail: mxzhang@whut.edu.cn
  • 6e-mail: qianjun@zju.edu.cn
  • show less
    DOI: 10.1364/PRJ.441471 Cite this Article Set citation alerts
    Huwei Ni, Yalun Wang, Tao Tang, Wenbin Yu, Dongyu Li, Mubin He, Runze Chen, Mingxi Zhang, Jun Qian. Quantum dots assisted in vivo two-photon microscopy with NIR-II emission[J]. Photonics Research, 2022, 10(1): 189 Copy Citation Text show less
    Schematic illustration of 2PFLIM system (PMT as the detector) in the NIR-II region. 0) 1550 nm fs laser; 1) half-wave plate; 2) polarization beam splitter (PBS); 3) photodiode; 4,5) reflector; 6) scanning galvanometer; 7,8,11) lens; 9) dichroic mirror; 10) objective; 12) large beam collimator; 13) PMT; 14) TCSPC board; 15) computer. Dashed box is the scanning microscope.
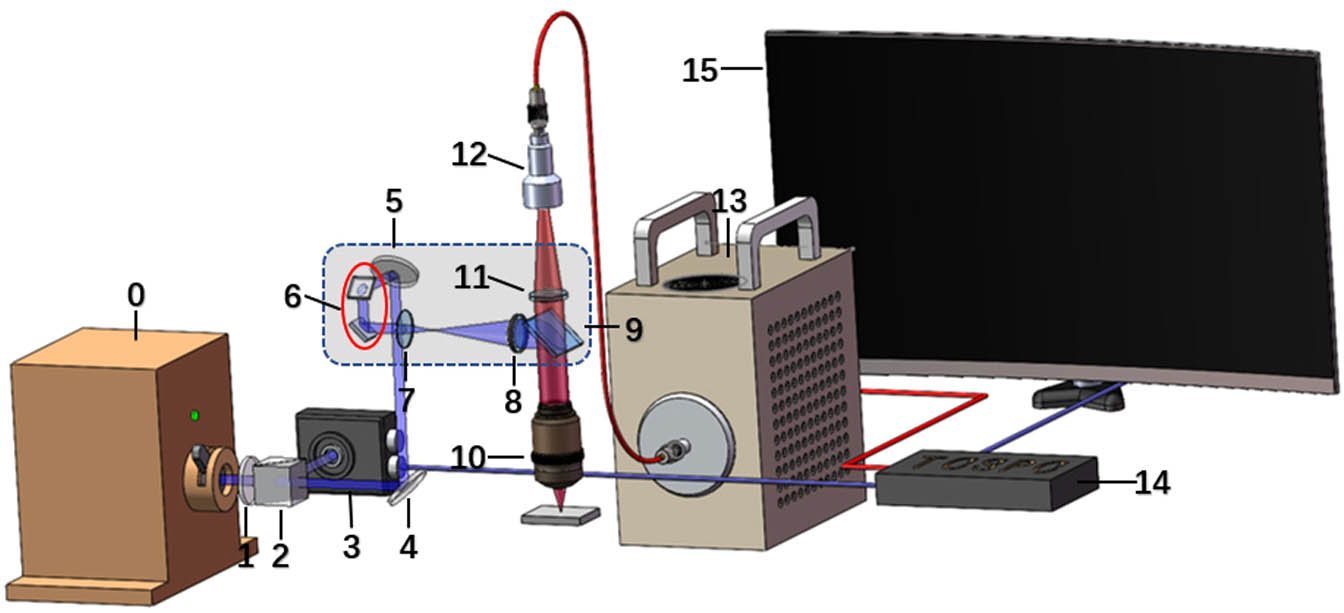
    Fig. 1. Schematic illustration of 2PFLIM system (PMT as the detector) in the NIR-II region. 0) 1550 nm fs laser; 1) half-wave plate; 2) polarization beam splitter (PBS); 3) photodiode; 4,5) reflector; 6) scanning galvanometer; 7,8,11) lens; 9) dichroic mirror; 10) objective; 12) large beam collimator; 13) PMT; 14) TCSPC board; 15) computer. Dashed box is the scanning microscope.
    Morphological characterization and optical properties of PbS/CdS quantum dots (PbS QDs). (a) Transmission electron microscopy (TEM) image of PbS QDs. (b) Dynamic light scattering (DLS) profile of PbS QDs. (c) One-photon and multiphoton fluorescence spectra of PbS QDs. (d) Relationship of 1550 nm fs excitation power and fluorescence intensity from QDs.
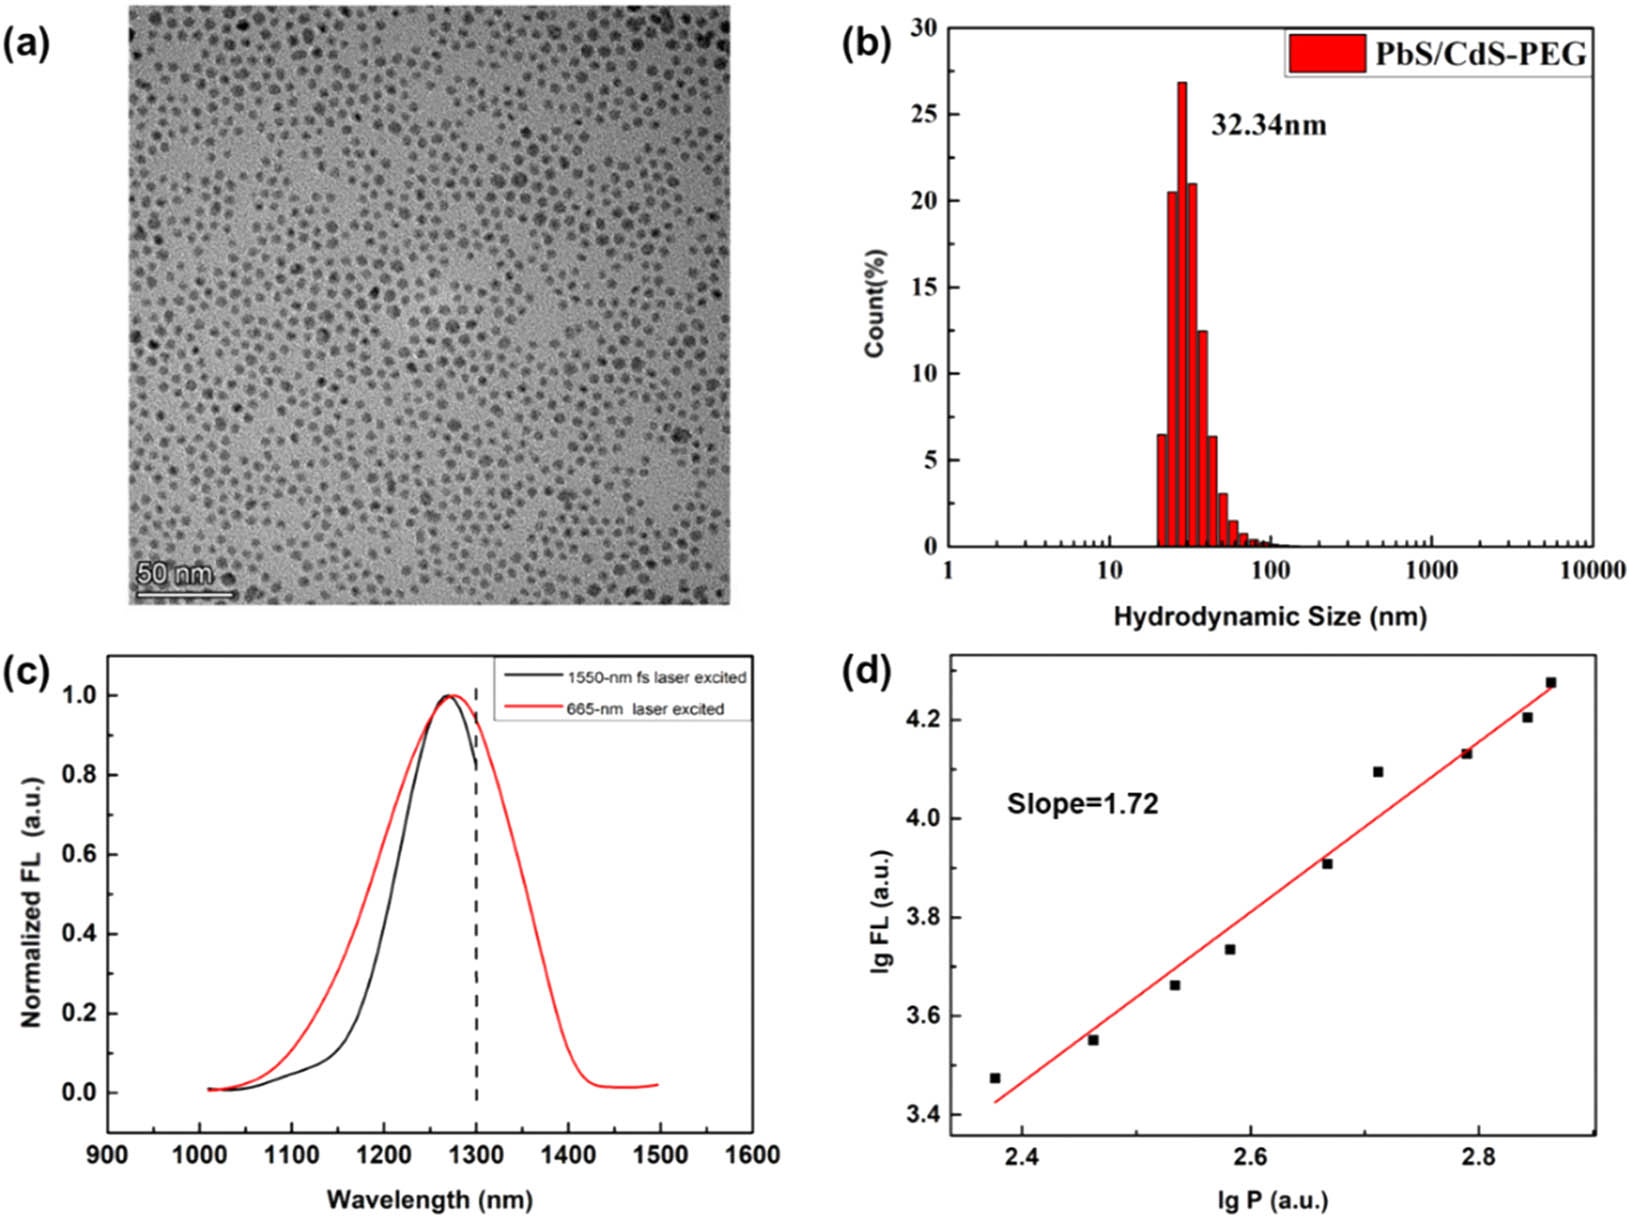
    Fig. 2. Morphological characterization and optical properties of PbS/CdS quantum dots (PbS QDs). (a) Transmission electron microscopy (TEM) image of PbS QDs. (b) Dynamic light scattering (DLS) profile of PbS QDs. (c) One-photon and multiphoton fluorescence spectra of PbS QDs. (d) Relationship of 1550 nm fs excitation power and fluorescence intensity from QDs.
    In vivo 2PFLIM images of QDs-stained mouse brain blood vessels with PMT. (a) 2PF intensity images of brain blood vessels at different vertical penetration depths: from 0 to 220 μm. Scale bar: 50 μm. (b) 2PF lifetime image at 60 μm. (c) Time-resolved decay curve at the arrow in (b). (d) 2PFLIM image at 220 μm. (e) Time-resolved decay curve at the arrow in (d). (f)–(i) Plots of each FWHM of blood vessels at depth of 100, 140, 180, and 220 μm, as indicated by the yellow lines in (a), respectively.
    Fig. 3. In vivo 2PFLIM images of QDs-stained mouse brain blood vessels with PMT. (a) 2PF intensity images of brain blood vessels at different vertical penetration depths: from 0 to 220 μm. Scale bar: 50 μm. (b) 2PF lifetime image at 60 μm. (c) Time-resolved decay curve at the arrow in (b). (d) 2PFLIM image at 220 μm. (e) Time-resolved decay curve at the arrow in (d). (f)–(i) Plots of each FWHM of blood vessels at depth of 100, 140, 180, and 220 μm, as indicated by the yellow lines in (a), respectively.
    (a) Schematic illustration of 2PFM system (InGaAs camera as the detector) in the NIR-II region. 0) 1550 nm fs laser; 1) half-wave plate; 2) polarization beam splitter (PBS); 3,4) reflector; 5) scanning galvanometer; 6,7,10) lens; 8) dichroic mirror; 9) objective; 11) InGaAs camera; 12) computer. Dashed box is the scanning microscope. (b) 3D reconstructed image of fluorescence spots when laser is focused at different depths. (c) Statistics of fluorescence area at various depths.
    Fig. 4. (a) Schematic illustration of 2PFM system (InGaAs camera as the detector) in the NIR-II region. 0) 1550 nm fs laser; 1) half-wave plate; 2) polarization beam splitter (PBS); 3,4) reflector; 5) scanning galvanometer; 6,7,10) lens; 8) dichroic mirror; 9) objective; 11) InGaAs camera; 12) computer. Dashed box is the scanning microscope. (b) 3D reconstructed image of fluorescence spots when laser is focused at different depths. (c) Statistics of fluorescence area at various depths.
    Schematic diagram of image overlay: the blood vessel image in the blue box is superimposed by the other 15 frames. Scale bar: 50 μm.
    Fig. 5. Schematic diagram of image overlay: the blood vessel image in the blue box is superimposed by the other 15 frames. Scale bar: 50 μm.
    In vivo 2PFM images of QDs-stained mouse brain blood vessels with InGaAs camera. (a) 2PFM images of brain blood vessels at different vertical penetration depths: from 0 to 110 μm. Scale bar: 50 μm. (b)–(d) Plots of each FWHM of blood vessels at depths of 40, 60, and 80 μm as indicated by the yellow lines in (a), respectively.
    Fig. 6. In vivo 2PFM images of QDs-stained mouse brain blood vessels with InGaAs camera. (a) 2PFM images of brain blood vessels at different vertical penetration depths: from 0 to 110 μm. Scale bar: 50 μm. (b)–(d) Plots of each FWHM of blood vessels at depths of 40, 60, and 80 μm as indicated by the yellow lines in (a), respectively.
    Huwei Ni, Yalun Wang, Tao Tang, Wenbin Yu, Dongyu Li, Mubin He, Runze Chen, Mingxi Zhang, Jun Qian. Quantum dots assisted in vivo two-photon microscopy with NIR-II emission[J]. Photonics Research, 2022, 10(1): 189
    Download Citation