We report on the high-power amplification of a 1064 nm linearly polarized laser in an all-fiber polarization-maintained master oscillator power amplifier, which can operate at an output power level of 1.3 kW. The beam quality () was measured to be at full power operation. The polarization extinction rate of the fiber amplifier was measured to be above 94% before mode instabilities (MIs) set in, which reduced to about 90% after the onset of MI. The power scaling capability of strategies for suppressing MI is analyzed based on a semianalytical model, the theoretical results of which agree with the experimental results. It shows that mitigating MI by coiling the gain fiber is an effective and practical method in standard double-cladding large mode area fiber, and, by tight coiling of the gain fiber to the radius of 5.5 cm, the MI threshold can be increased to three times higher than that without coiling or loose coiling. Experimental studies have been carried out to verify the idea, which has proved that MI was suppressed successfully in the amplifier by proper coiling.
Many applications, such as coherent lidar systems, nonlinear frequency conversion, and coherent beam combining architectures, require high-power linearly polarized laser sources with near-diffraction-limited beam quality [1–6]. Recently, a linearly polarized fiber laser with 1 kW output power has been achieved in a monolithic fiber Bragg grating (FBG)-based Fabry–Perot cavity [7], which employed a pair of high-power FBGs. It is a technological challenge to design an FBG that can withstand multikilowatt power, and further power scaling may encounter some technological difficulties. Fiber laser systems based on master oscillator power amplifiers (MOPAs) are typically capable of reaching high output powers, while also offering more flexibility in terms of linewidth and polarization control than a simple grating-based laser [8]. Most of the high-power fiber laser systems with random polarized output are based on MOPAs at the moment, which has achieved output power as high as tens of kilowatts. However, power scaling of linearly polarized MOPAs to multikilowatt level is currently limited by the onset of mode instabilities (MIs) [8–10]. Although lots of work has been carried out to deal with MI experimentally and theoretically [11–27], few methods to mitigate MI effectively in the all-fiber MOPA configuration with standard step-index large mode area (LMA) fiber have been proposed, and MI-free power scaling in an all-fiber MOPA, which is based on standard step-index polarization-maintaining (PM) LMA fibers, is even more challenging.
In this paper, we present a 1.3-kW-level all-fiber Yb-doped PM fiber amplifier with linearly polarized operation and near-diffraction-limited beam quality. We also discuss experiments, coupled with numerical modeling, to estimate the further power scaling capability of various strategies to mitigate MI. Numerical modeling results suggest that MI-free single-mode output powers in excess of 3 kW could be realized in standard step-index LMA fiber.
2. EXPERIMENTAL SETUP AND RESULTS
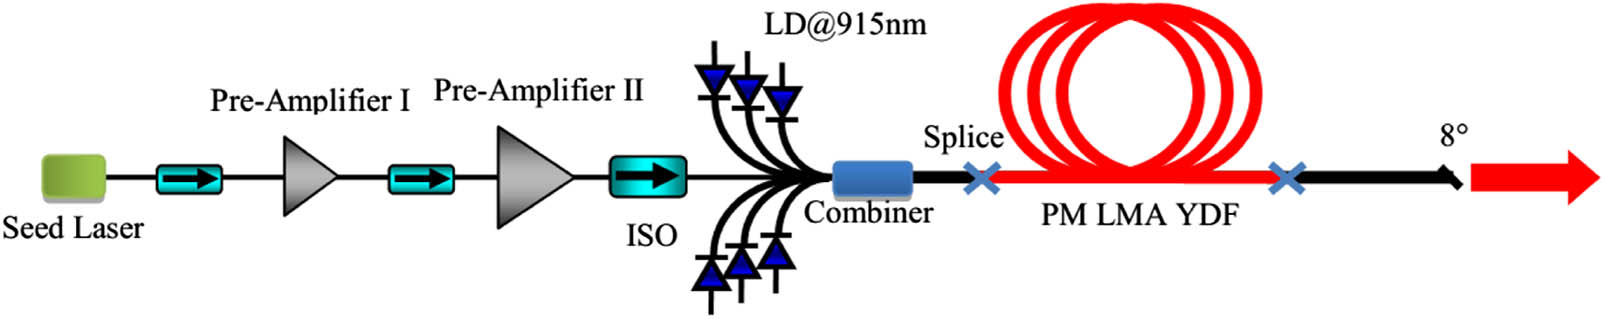
A monolithic, all-fiber, Yb-doped PM fiber amplifier is shown in Fig. 1. The seed laser in the experiment is a 50 mW linearly polarized continuous-wave laser with central wavelength at , which was then amplified in two preamplifier stages to . The main amplifier consists of a 20 m PM double-clad LMA Yb-doped fiber (YDF) with 21 μm diameter/0.064 NA core and 400 μm diameter/0.44 NA cladding, which is coiled in a radius of 10 cm. Six multimode fiber-pigtailed 915 nm laser diodes were used to pump the gain fiber through a signal/pump combiner, which can provide a maximum pump power of about 2 kW. An approximately 0.75 m long passive fiber is spliced to the gain fiber for power delivery, the output end of which is angle cleaved in order to prevent parasitic feedback from Fresnel reflection.
Sign up for Photonics Research TOC. Get the latest issue of Photonics Research delivered right to you!Sign up now
Figure 1.Architecture of the all-fiber PM amplifier.
The achieved output power at different pump power levels is shown in Fig. 2(a), which is measured after the output beam passed through a dichroic mirror. The slope efficiency of the amplifier is 65.3% with respect to launched pump power, and the pump-limited maximum output power is 1261 W. The inset in Fig. 2(a) shows the measured far-field beam profile at the maximal operation power, and the beam quality factor is measured by -200 s (Spiricon) to be in both directions. Figure 2(b) shows the measured spectra (by an optical spectrum analyzer, AQ6370C Yokogawa) at full power operation, which shows that a high signal-to-noise ratio (SNR) has been achieved and shows no signs of parasitic lasing or significant levels of amplified spontaneous emission. Figure 2(c) shows the measurement of the polarization extinction rate (PER) for different pump power levels. It can be seen that the PER is above 90% in the whole range, which indicates a linearly polarized operation. The sudden degradation from 94% to 90% above 1.2 kW was caused by MI, while the slow degradation of PER as lasing power increases may be caused by the temperature increase of the fiber.
Figure 2.Output characteristics of the main amplifier. (a) Output power. (b) Output spectrums. (c) PER.
An InGaAs photodetector (150 MHz, 700–1800 nm, Thorlabs) with a pinhole of 1.5 mm diameter was put in the center of the collimated beam to monitor the onset of MI [14,15,25]. Time traces at different output powers are shown in Fig. 3(a), and the DC component of the electrical signal is removed. From Fig. 3(a), we can obtain that although the output power is still pump limited to 1.26 kW, we are operating at the MI threshold (@1.26 kW). Although the MI has set in, deterioration of beam quality has not been observed [Fig. 2(a)], which is due to the fact that the fraction of high-order mode (HOM) is relatively small at the beginning of MI [24]. It also shows that, at the onset of MI, the amplitude of the time trace is close to the same as that without MI in the time period T1 and becomes higher than that without MI in time period T2. Applying Fourier analysis on the time traces to calculate the corresponding Fourier spectra, we obtained the frequency distribution of the beam fluctuation as shown in Fig. 3(b). The frequency components of the beam fluctuations distributed in the range of 0–200 Hz at power of 1.14 kW, which means that the output beam profile is stable; however, further increasing the output power, frequency components in 0–3 kHz showed up as well as background noise increased, which indicated that the sign of the instable beam profile appeared and that the amplifiers were approaching the threshold. Similar to the observation in [26], the instability of MI has a grown process: at the start (T1), only background noise increases, which means a stable beam profile and indicates that MI may relate to noise [17]; after a few seconds (T2), frequency components show up, which indicates an unstable beam profile. After multiple power cycles near the maximum power, we observed that the threshold reduced to below 1.2 kW and was finally stabilized around 1180 W, which may due to the fiber degradation [9,27]. It is claimed in [27] that the fiber degradation, which results in the decrease of MI threshold power, is related to the color center formation commonly associated with photodarkening phenomena. The fiber degradation—photodarkening—that induces the threshold decrease of MI is hard to quantify directly: although the MI threshold power reduced, the measured output lasing power remained the same, which means that the system can be considered nearly “photodarkening free” from the practical application. This is due to the fact that the gain available in the fiber will compensate for the extra losses introduced by photodarkening [28]. Based on the aforementioned discussion, it is hard to quantify the fiber degradation directly [29]. However, the MI threshold decreasing can be considered as an indication of the degradation indirectly. If we take it as the criterion to quantify the fiber degradation, the fiber used in the experiment is degraded by 6% ().
Figure 3.Fluctuation characteristics of the output beam. (a) Time traces. (b) Frequency distribution.
As shown in the previous section, the linearly polarized single-mode output of the fiber laser is limited by the onset of MI. Work should be carried out to study the further power scaling of the amplifier with single-mode linearly polarized output. One way is to carry out numerical study on MI and to find a way to mitigate this phenomenon effectively. In high-power fiber laser systems, most of the fibers are weakly guided fibers, where optical fields can be well approximated by linearly polarized (LP) modes. For linearly polarized fiber lasers, the optical field of the signal propagating in the fiber is expressed in the conventional LP mode representations where and are the azimuthal and radial mode numbers, respectively. , , and are the slowly varying mode amplitudes, propagation constants, and normalized mode profiles of the mode. Assuming the case in which the fiber amplifiers are operating below or near the MI threshold, we therefore include only the fundamental mode ( and one of the two degenerate modes, and the subscripts of 01 and 11 are replaced with 1 and 2 for the mode and the mode, respectively. Then the signal intensity can be written as with Here is the refractive index of the fiber core.
The temperature distribution is governed by the heat transportation equation, which is given by where , is the density, is the specific heat capacity, and is the thermal conductivity. Since the heat in high-power fiber amplifiers is mainly generated from the quantum defect and absorption, the volume heat-generation density can be approximately expressed as and is the gain of the amplifier where represents the optical frequencies, and are the signal absorption and emission cross sections, and are the pump absorption and emission cross sections, is the doping profile, and the steady-state population inversion is given in [16]. For the case in which the fiber is doped uniformly, is a constant across the doping area, which is equal to the dopant concentration .
Assume that the fiber is water cooled; the appropriate boundary condition for the heat equation at the fiber surface is where is the convection coefficient for the cooling fluid. By adopting the integral-transform technique to separate variables in the cylindrical system [30], Eq. (4), combined with Eqs. (5) and (6), can be solved as with where and we replace by for , is the thermal-optic coefficient, is the radius of the inner cladding, is the small signal gain, and is the saturation intensity. is a Bessel function of the first kind, and represents the positive roots of . Solving the time-dependent temperature equation by the integral-transform technique is different from other models, such as solving the temperature equation using different summations of Bessel functions [18] or Green’s functions [17,19,20], or other numerical methods [13]. Considering the effective refractive index of gain from the amplifier, the total refractive index, which attributes to gain () and nonlinearity (), can be expressed as where is given by with
Inserting Eqs. (1) and (10) into the wave equation, after very tedious but straightforward derivations, we have obtained the coupled-mode equations with
By taking the similar derivation process in [17], we can obtain the HOM content for the quantum noise (QN) induced MI from Eq. (1), which is given as where is the length of the gain fiber. For the other case in which MI is seeded by intensity noise, we can obtain where is the relative intensity noise (RIN) of the input signal, is the initial HOM content, is the bend-induced power loss by fiber coiling, and is the length of the coiled length. Here bend-induced loss is taken into consideration in a simple way, and the effect of bend-induced mode distortion has not been considered. Here we achieved a semianalytical model, which is different from the numerical model in [31]. In [31], the integral-transform technique was also employed to solve the time-dependent temperature equation.
B. Numerical Results
In this section, we have calculated the MI threshold power of the amplifier based on the model. The parameters of the fiber are the same as those in the experiment, which are listed in Table 1. The fiber was doped uniformly, and . The initial signal power is 20 W.
First, we calculated the MI threshold power of the amplifier. Figure 4(a) shows the HOM content versus the pump power. It is shown that the quantum-induced-MI threshold power is about 4.7 kW. However, the intensity noise of the signal (, which corresponds to a laser with high RIN, which yields a realistic MI threshold [32,33]) reduces the threshold to about 2 kW, which agrees well with the experimental results. The initial HOM is set to be 0.01. By reducing the intensity noise of the signal (), the MI threshold power can be increased by , which means that measures taken to reduce the intensity noise of the input signal result in only modest improvements in the MI threshold and adding to the overall complexity of the system [34]. The influence of HOM power was also calculated in Fig. 4(b), which shows that the efforts to optimize the in-coupling of the signal have little impact on the MI threshold, which agrees with the experimental results [13].
Figure 4.Threshold calculation of the fiber amplifier.
It is reported in [35] that the MI threshold power can be increased obviously by increasing cladding diameters. This is contradictive to those reported in [11], which shows that the improvement by increasing the cladding diameter was not large enough for significant power scaling. To study the effect of cladding diameter on MI threshold power, we calculated the MI threshold pump power for different cladding diameters, which is shown in Fig. 5. The computed thresholds are seen to rise with increasing cladding diameters and the resulting increasing degree of population saturation [35]. However, for fiber with larger core diameters, the improvement becomes less significant, which explained the experimental results in [11]. Although MI threshold power can be improved by increasing cladding diameter, longer length is required for fibers with larger cladding diameter to maintain good amplifier efficiency, which makes other nonlinear effect suppression more challenging.
Figure 5.Threshold pump power for different fiber cladding diameters.
Coiling the fiber with a diameter small enough to induce mode-dependent bend losses can suppress HOM effectively [36], which can improve the MI threshold [23,37]. The threshold power of the amplifier with tight coiling was calculated in Fig. 6. Bend losses for the mode are calculated using the method of Marcuse [38]: the bending loss is for bending radius of 6.5 cm, for 6 cm, and for 5.5 cm. An additional correction factor, yielding an effective bending diameter, incorporates the material stress-optic effect [39]. In practice, only the first half of the gain fiber is coiled with small diameter, so is set to be 6 m. These coiling radii are chosen for long-term use. This shows that tight coiling of the fiber can increase the MI threshold power significantly: when coiling at the radius of 5.5 cm, the MI threshold is three times higher than that without coiling or loose coiling, which means that tight coiling of the gain fiber is an effective method to mitigate MI in the all-fiber MOPA configuration with standard step-index LMA fiber. For the case in the experiment, MI is no longer a limitation since the onset of other nonlinear effects, such as SBS and/or SRS, should come into consideration first.
To verify our theoretical predication of the effect of coiling, we have rebuilt our fiber amplifiers with gain fiber coiled at the diameter of . Then we have an MI-free 1280 W linearly polarized single-mode laser, and all phenomena related to the onset of MI, such as temporal fluctuation and PER degradation, have vanished [as shown in Figs. 7(a) and 7(b)]. Due to the available pump power, the power scaling capabilities by the coiling method have not been fully exploited. The advantage of employing the coiling technique is that it is straightforward to implement, as most fibers are coiled in packaging anyway, and no special gain profiles are necessary to give preferential gain to fiber modes. In addition, the PER of the amplifier has also been improved to at the maximal operation. The results also indicate that MI can be mitigated by designing fiber with an improved delocalization of HOM, such as chirally coupled core (CCC) fiber [40], leakage channel fibers [41], and all-solid photonic bandgap fibers [42].
Figure 7.Fluctuation characteristics of the output beam after tight coiling. (a) Time trace (b) Frequency distribution.
We have generated a high-power linearly polarized single-mode output laser from a Yb-doped PM fiber amplifier, which operated at . The slope efficiency of the amplifier is 65.3% with respect to launched pump power, and the maximal output power is 1261 W. The M2 at full power operation is measured to be in both directions. The linear polarization operation was deteriorated by the onset of MI above 1.2 kW. The PER is measured to be without MI, which reduced to about 90% after the onset of MI. A novel theoretical model to study MI has been built up, and the numerical results agree well with the experimental observation. Various methods to improve the power scaling capability of the amplifier without MI have been studied numerically, which reveal that MI can be suppressed by proper coiling and the amplifier in the paper has the potential to deliver MI-free 3 kW output power. An additional experiment has been carried out to study the effect of coiling on MI, which rebuilt the amplifier with tighter coiling. It is shown that MI was suppressed successfully in the amplifier by tight coiling.
[5] B. Samson, A. Carter. Recent progress on power scaling narrow linewidth fiber amplifiers and their applications. Rev. Laser Eng., 41, 714-717(2010).
[6] A. Carter, J. Edgecumbe, D. P. Machewirth, J. Galipeau, B. Samson, K. Tankala, M. O’Connor. Recent progress in the development of kW-level monolithic PM-LMA fiber amplifiers. Proc. SPIE, 6344, 6344F(2006).
[28] C. Jauregui, H.-J. Otto, N. Modsching, O. de Vries, J. Limpert, A. Tünnermann. The impact of photodarkening on mode instabilities in high power fiber laser systems, ATh2A.1(2014).
[29] B. Samson, G. Frith, A. Carter, K. Tankala. High-power large-mode area optical fibers for fiber lasers and amplifiers. OFC/NFOEC(2008).