• Acta Optica Sinica
  • Vol. 38, Issue 7, 0706001 (2018)
Gang Gao1、2, Jun Li1, Xu’an Liu1、2, Bo Shi1、2, Yuquan Tang1, Tao Pang1, Qing Zheng3, Liming Sun3, and Fengzhong Dong1、2、*
Author Affiliations
  • 1 Anhui Provincial Key Laboratory of Photonic Devices and Materials, Anhui Institute of Optics and Fine Mechanics, Chinese Academy of Sciences, Hefei, Anhui 230031, China
  • 2 University of Science and Technology of China, Hefei, Anhui 230026, China
  • 3 Hefei Cement Research and Design Institute, Hefei, Anhui 230051, China
  • show less
    DOI: 10.3788/AOS201838.0706001 Cite this Article Set citation alerts
    Gang Gao, Jun Li, Xu’an Liu, Bo Shi, Yuquan Tang, Tao Pang, Qing Zheng, Liming Sun, Fengzhong Dong. Bag Filter Leak Detection and Location Based on Phase-Sensitive Optical Time Domain Reflectometry[J]. Acta Optica Sinica, 2018, 38(7): 0706001 Copy Citation Text show less
    (a) Schematic of φ-OTDR system; (b) system prototype
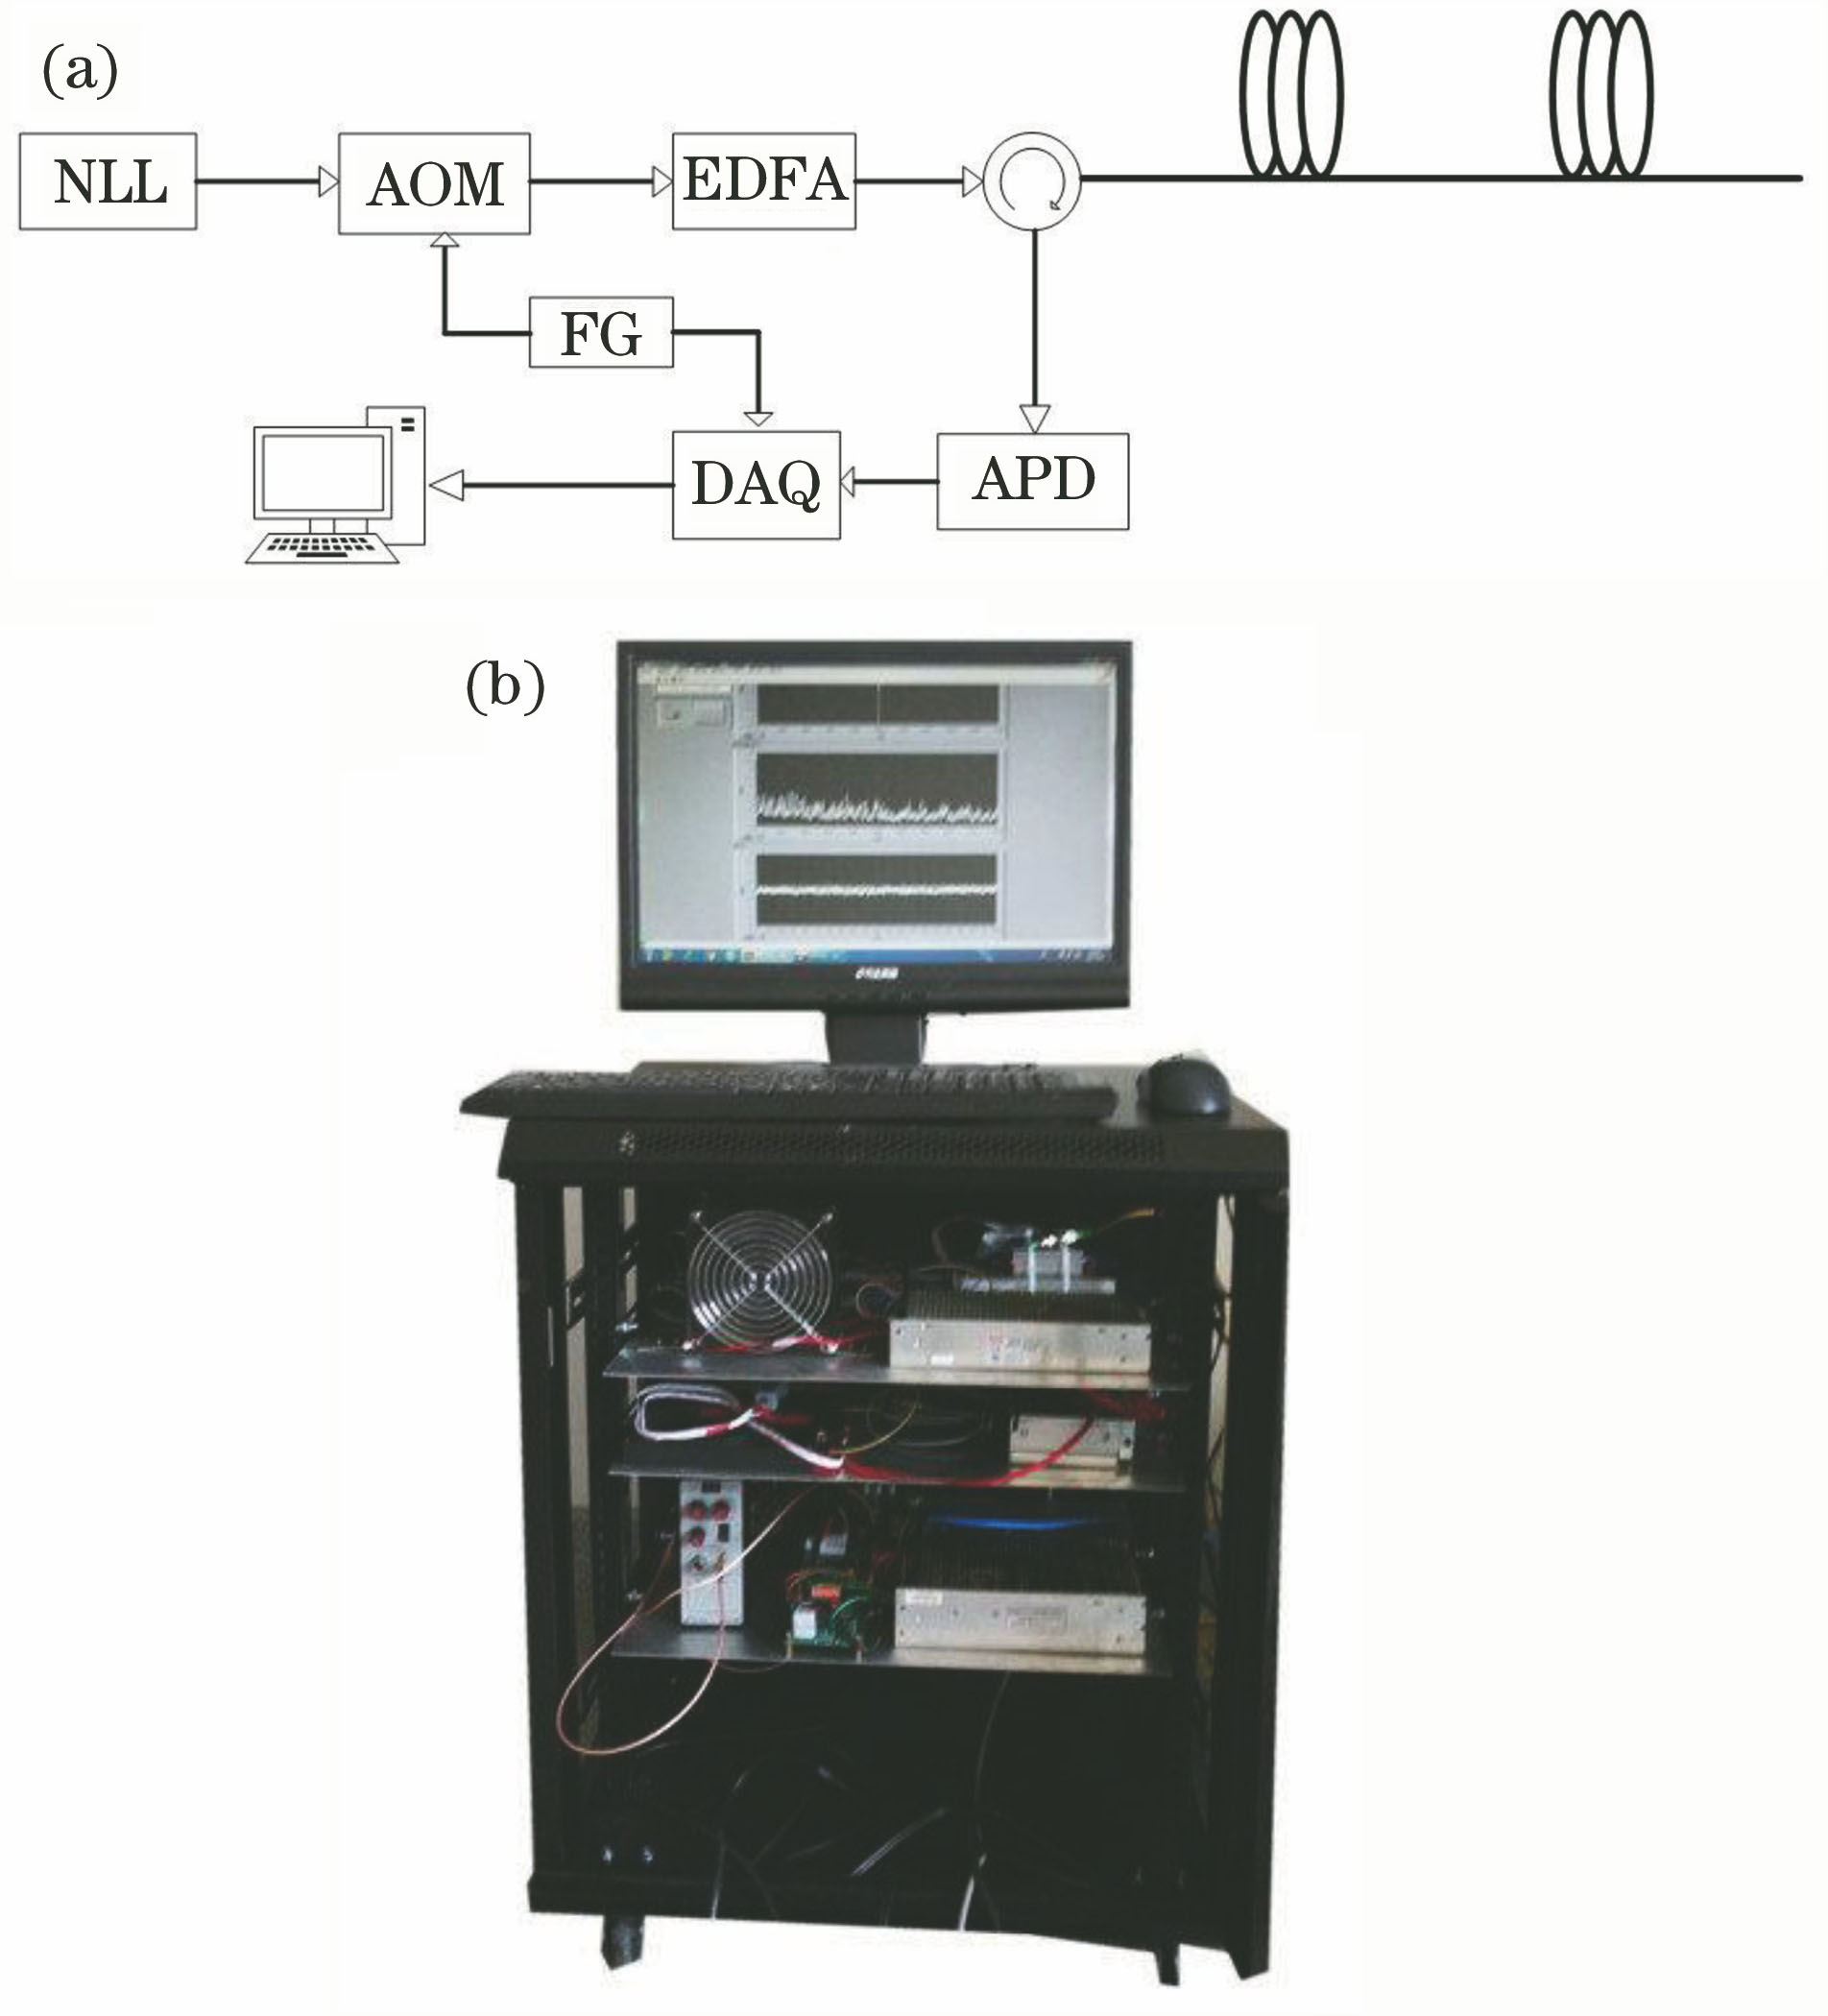
    Fig. 1. (a) Schematic of φ-OTDR system; (b) system prototype
    Schematic of back pulse-cleaned bag filters
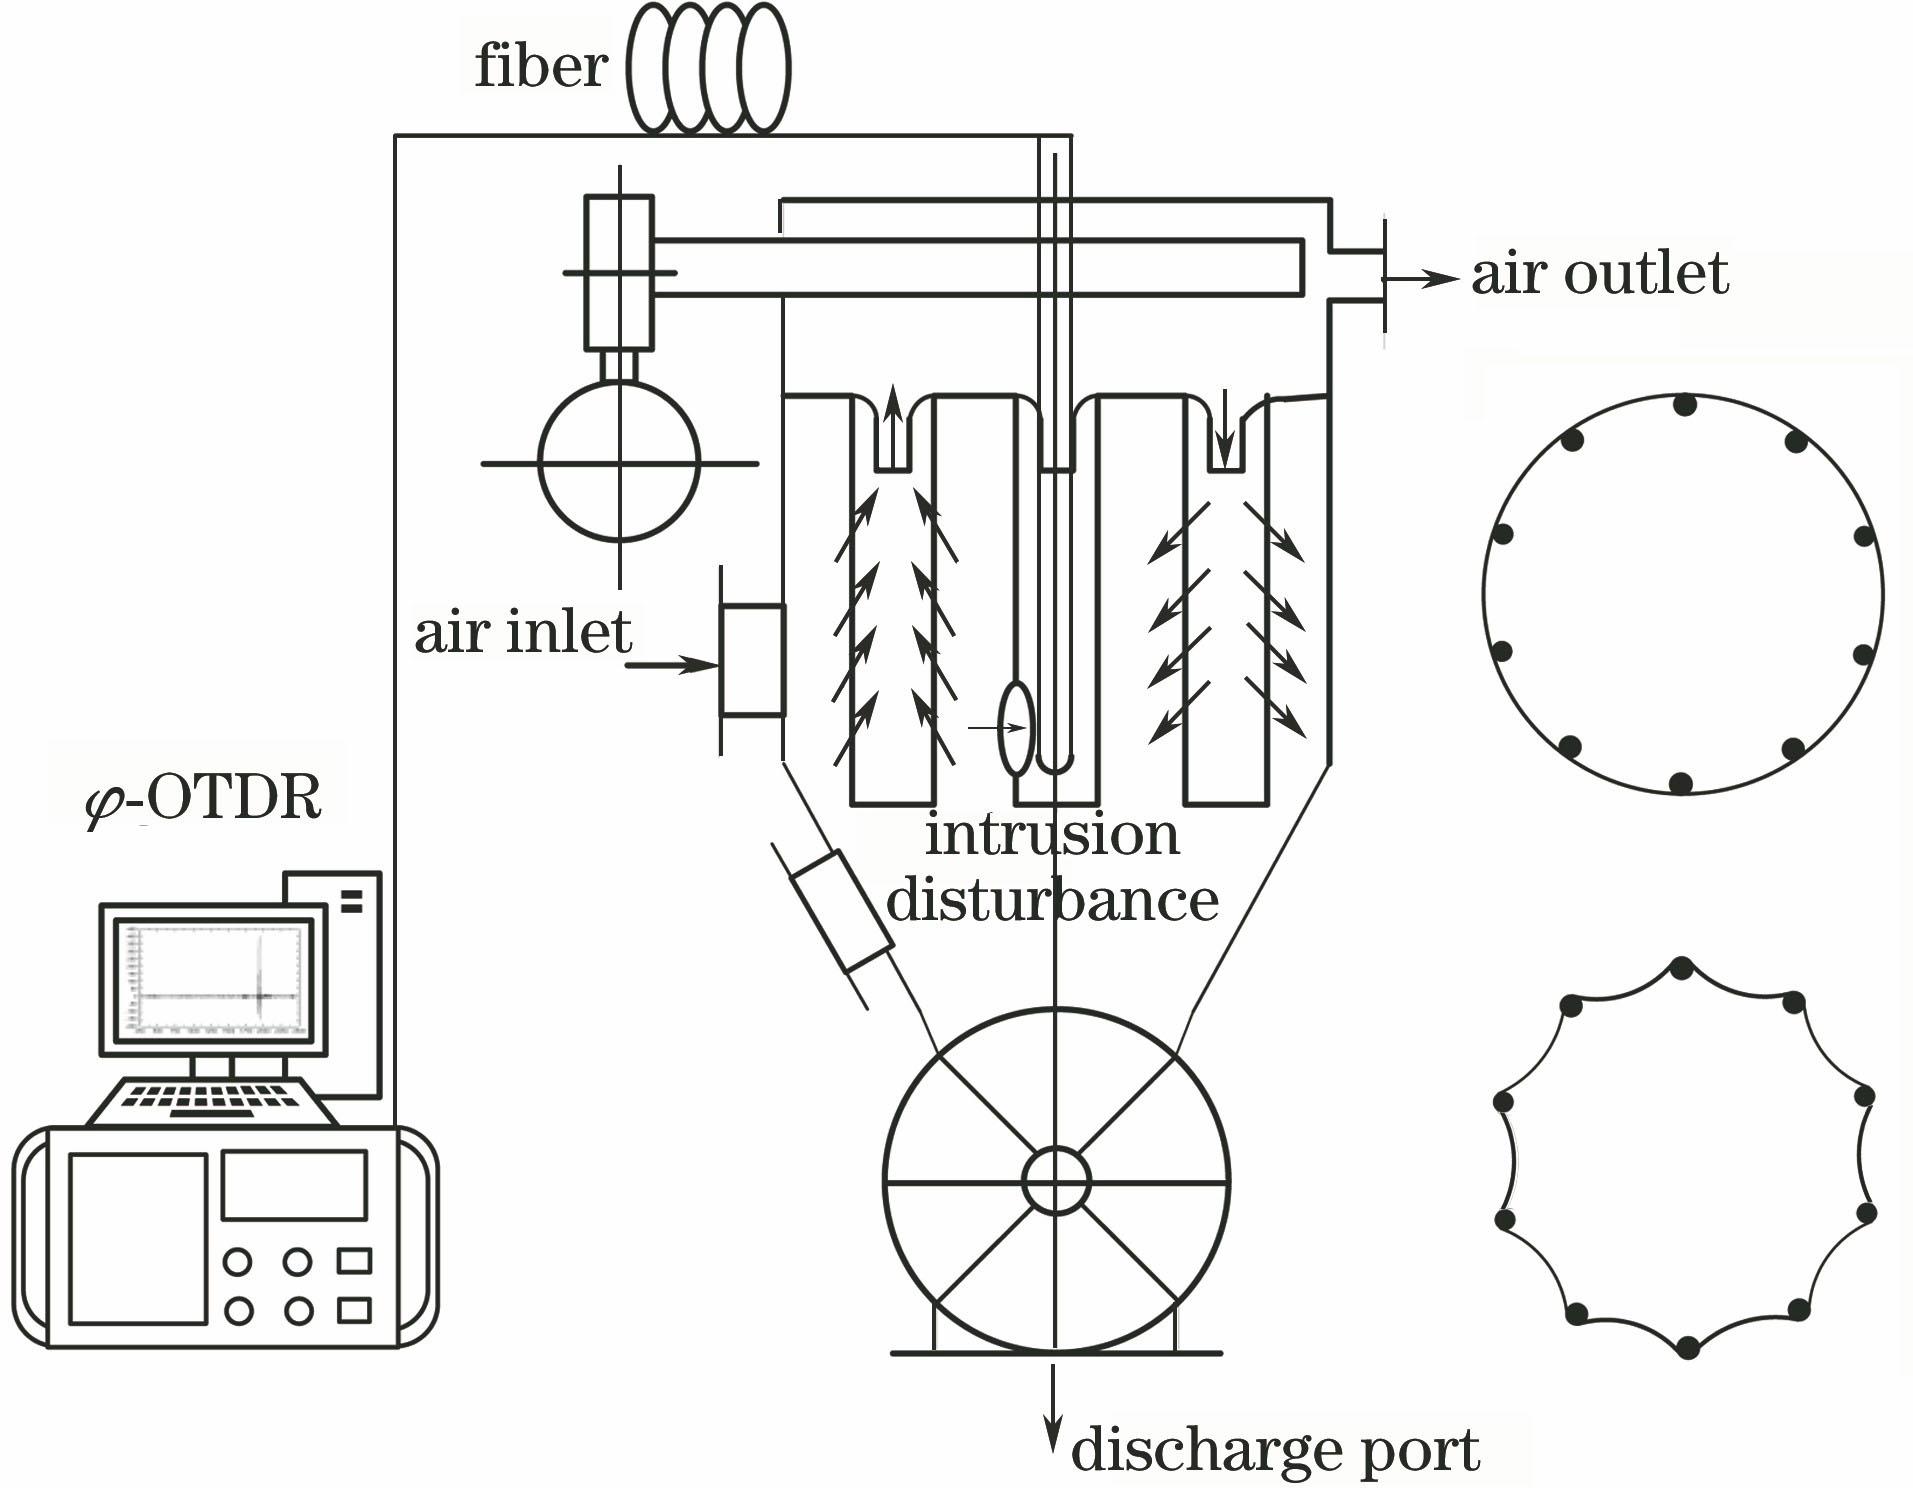
    Fig. 2. Schematic of back pulse-cleaned bag filters
    Configuration of simulation platform in laboratory
    Fig. 3. Configuration of simulation platform in laboratory
    (a) Superposition of 20 consecutive Rayleigh traces; (b) adjacent time-domain difference of the superposition; (c) positioning accuracy; (d) spatial resolution
    Fig. 4. (a) Superposition of 20 consecutive Rayleigh traces; (b) adjacent time-domain difference of the superposition; (c) positioning accuracy; (d) spatial resolution
    (a) Frequency spectrum at 100 Hz; (b) contour map of 100 Hz frequency response
    Fig. 5. (a) Frequency spectrum at 100 Hz; (b) contour map of 100 Hz frequency response
    Contrast diagram of the frequency response contour of three bags
    Fig. 6. Contrast diagram of the frequency response contour of three bags
    (a) Experimental scene; (b) schematic of on-site optical fiber laying
    Fig. 7. (a) Experimental scene; (b) schematic of on-site optical fiber laying
    Amplitude-frequency characteristics of normal bags (1-500) and broken bags (500-1000). (a)(b) Frequency spectra contract at 1561 m location; (c)(d) frequency spectra contract at 1493 m and 1561 m locations
    Fig. 8. Amplitude-frequency characteristics of normal bags (1-500) and broken bags (500-1000). (a)(b) Frequency spectra contract at 1561 m location; (c)(d) frequency spectra contract at 1493 m and 1561 m locations
    (a) Visual model of classification at 1561 m location; (b) visual model of classification at 1493 m and 1561 m locations
    Fig. 9. (a) Visual model of classification at 1561 m location; (b) visual model of classification at 1493 m and 1561 m locations
    Serial no.AmountAccurateamountAccuracyrate /%Averageaccuracy rate /%
    11009494
    21009191
    3100969693.8
    41009797
    51009191
    Table 1. Classification results of two different kinds of bags at the same place of 1561 m
    Serial no.AmountAccurateamountAccuracyrate /%Averageaccuracy rate /%
    11009797
    2100100100
    3100989897.8
    41009797
    51009797
    Table 2. Classification results of two different kinds of bags at the same time
    Gang Gao, Jun Li, Xu’an Liu, Bo Shi, Yuquan Tang, Tao Pang, Qing Zheng, Liming Sun, Fengzhong Dong. Bag Filter Leak Detection and Location Based on Phase-Sensitive Optical Time Domain Reflectometry[J]. Acta Optica Sinica, 2018, 38(7): 0706001
    Download Citation