• Photonics Research
  • Vol. 9, Issue 1, 73 (2021)
Liyong Jiang1、4、†,*, Jianli Jiang1、†, Zebin Zhu1, Guanghui Yuan2, Ming Kang3, and Ze Xiang Shen2、5、*
Author Affiliations
  • 1Institute of Micro-nano Photonics & Beam Steering, School of Science, Nanjing University of Science and Technology, Nanjing 210094, China
  • 2Centre for Disruptive Photonic Technologies, The Photonics Institute, School of Physical and Mathematical Sciences, Nanyang Technological University, Singapore 637371, Singapore
  • 3College of Physics and Electronic Information Science, Tianjin Normal University, Tianjin 300387, China
  • 4e-mail: jly@njust.edu.cn
  • 5e-mail: zexiang@ntu.edu.sg
  • show less
    DOI: 10.1364/PRJ.404355 Cite this Article Set citation alerts
    Liyong Jiang, Jianli Jiang, Zebin Zhu, Guanghui Yuan, Ming Kang, Ze Xiang Shen. Plasmonic evolution maps for planar metamaterials[J]. Photonics Research, 2021, 9(1): 73 Copy Citation Text show less
    Schematic diagram and SEM images of the (a), (b) CSRR and (c), (d) H-shaped complementary planar metamaterials. From Sample I to Sample VI, different numbers of splits are introduced and arranged in designed symmetry/asymmetry. Δx represents the horizontal displacement of the split from the center. The symmetry/asymmetry of the H-shaped air slit is modulated by introducing a vertical displacement Δy of the horizontal air slit shift along the y direction. The scale bars in the figure are all 500 nm.
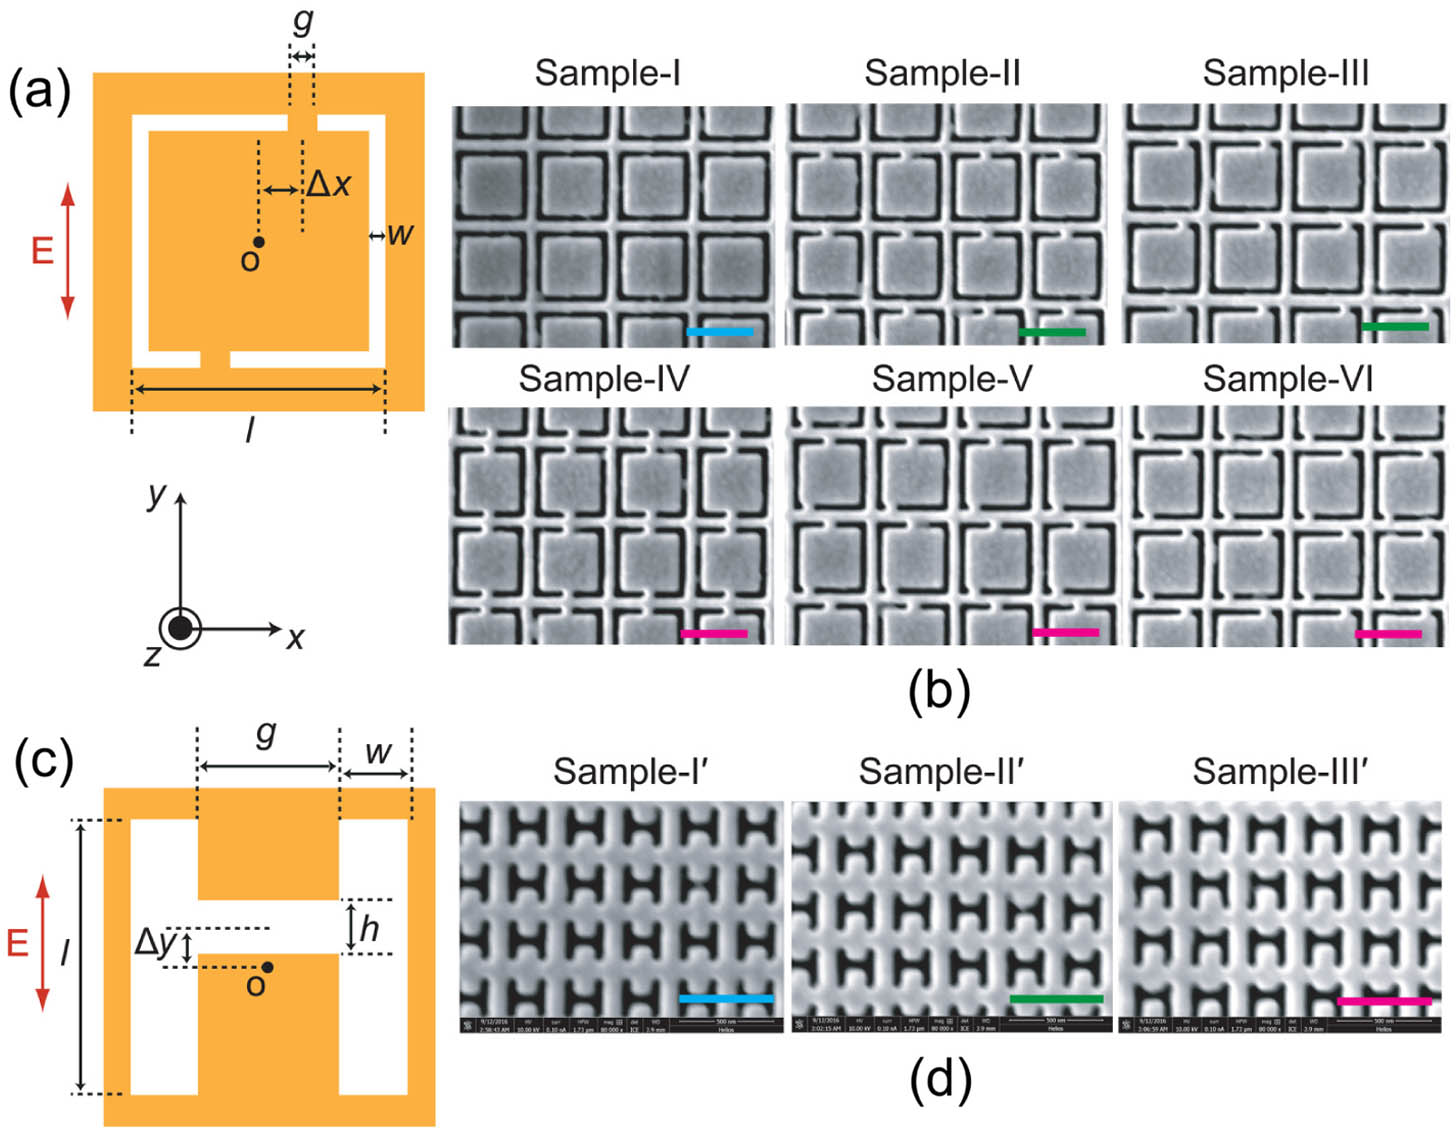
    Fig. 1. Schematic diagram and SEM images of the (a), (b) CSRR and (c), (d) H-shaped complementary planar metamaterials. From Sample I to Sample VI, different numbers of splits are introduced and arranged in designed symmetry/asymmetry. Δx represents the horizontal displacement of the split from the center. The symmetry/asymmetry of the H-shaped air slit is modulated by introducing a vertical displacement Δy of the horizontal air slit shift along the y direction. The scale bars in the figure are all 500 nm.
    Experimental and simulated reflection spectra of (a) Sample I, (b) Sample II, (c) Sample III, (d) Sample IV, (e) Sample V, and (f) Sample VI. The solid curve in each experimental spectrum serves as a guide for easier comparison.
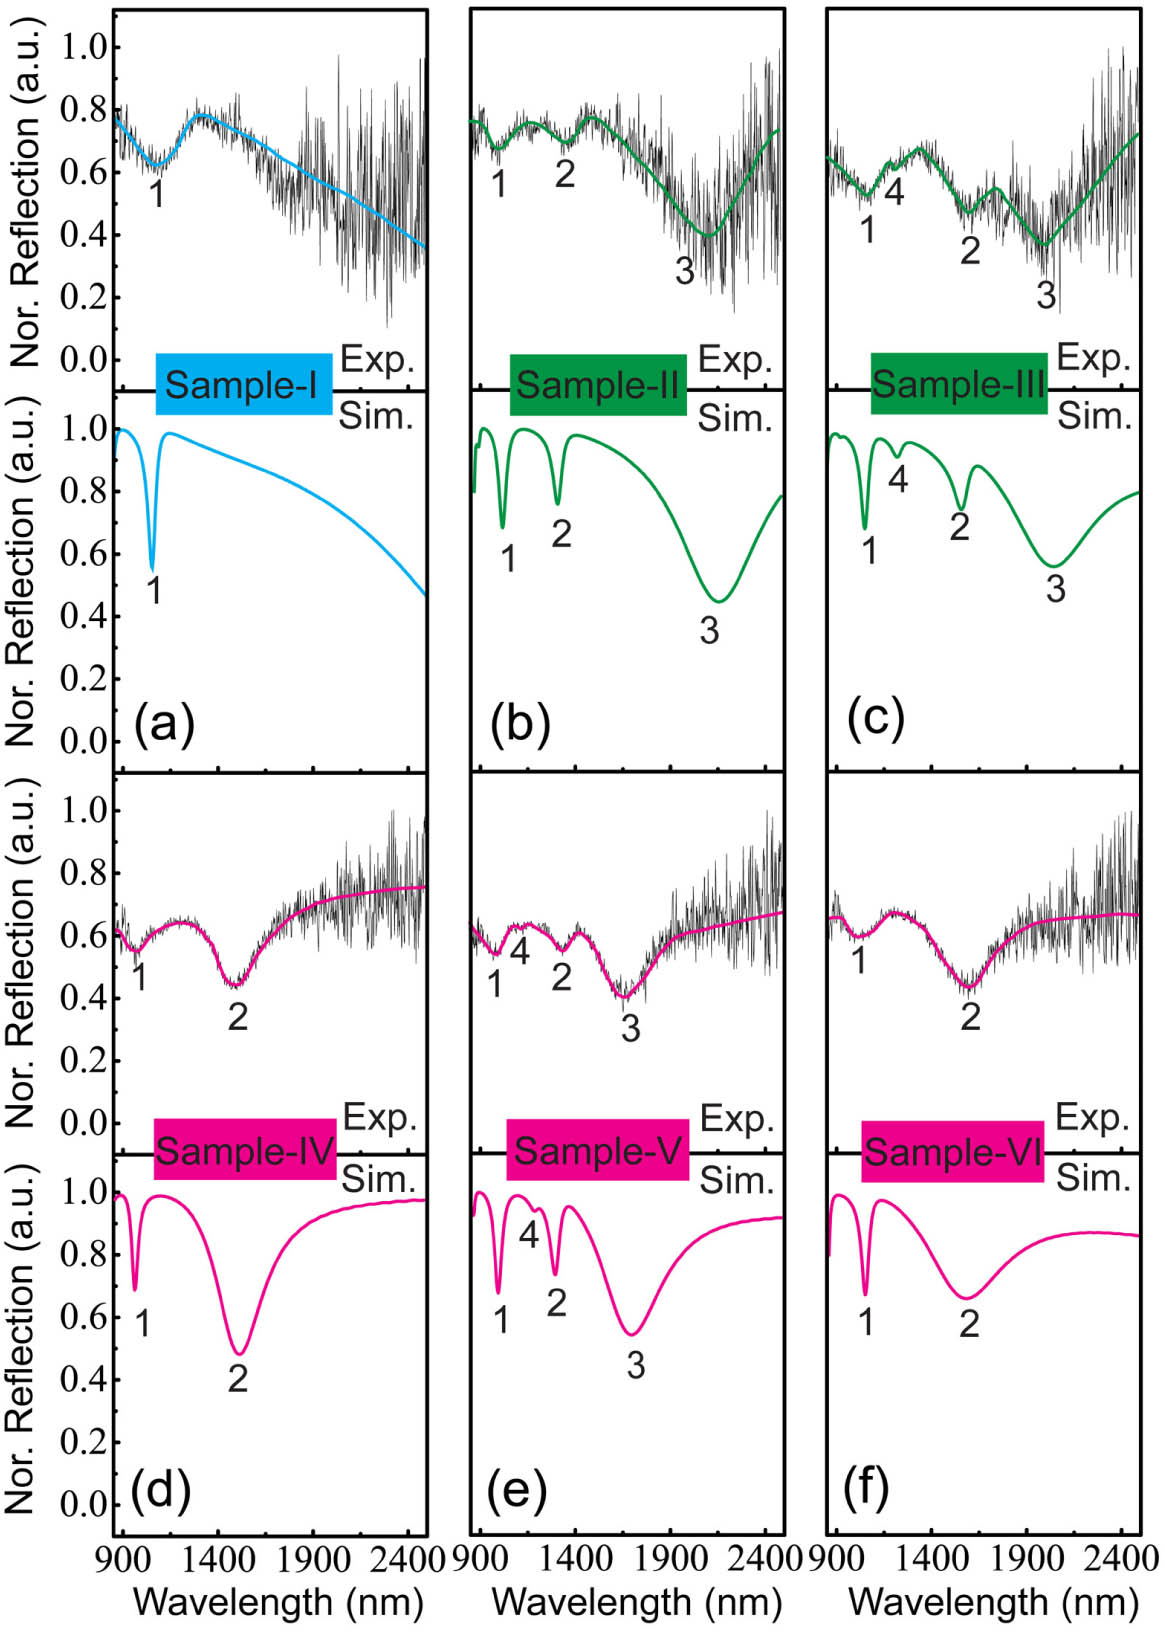
    Fig. 2. Experimental and simulated reflection spectra of (a) Sample I, (b) Sample II, (c) Sample III, (d) Sample IV, (e) Sample V, and (f) Sample VI. The solid curve in each experimental spectrum serves as a guide for easier comparison.
    Conventional mode analysis for Samples I–VI. (a), (d), (g), (j) Electric field distributions; (b), (e), (h), (k) charge distributions; (c), (f), (i), (l) current distributions. The big arrows serve as a guide to show the current directions at the metal/air surface. The symmetrically distributed currents in the plasmonic atom samples (I–III) are highlighted by green color, and the currents in the right atom of the plasmonic molecule samples (IV–VI) are highlighted by blue color.
    Fig. 3. Conventional mode analysis for Samples I–VI. (a), (d), (g), (j) Electric field distributions; (b), (e), (h), (k) charge distributions; (c), (f), (i), (l) current distributions. The big arrows serve as a guide to show the current directions at the metal/air surface. The symmetrically distributed currents in the plasmonic atom samples (I–III) are highlighted by green color, and the currents in the right atom of the plasmonic molecule samples (IV–VI) are highlighted by blue color.
    Conventional mode analysis for three H-shaped complementary planar metamaterials. (a), (b) Experimental and simulated reflection spectra; (c) electric field distributions; (d) charge distributions; (e) current distributions. The symmetrically distributed currents are highlighted by green color.
    Fig. 4. Conventional mode analysis for three H-shaped complementary planar metamaterials. (a), (b) Experimental and simulated reflection spectra; (c) electric field distributions; (d) charge distributions; (e) current distributions. The symmetrically distributed currents are highlighted by green color.
    Mode analysis based on PEMs for (a)–(d) Sample I and (e)–(h) Sample II. D, dipole-like; Q, quadrupole-like; H, hexapole-like; O, octopole-like charge distributions; SCD/SCQ/SCH/SCO, symmetrically coupled dipole-like/quadrupole-like/hexapole-like/octopole-like charge distributions; ASSCD/ASSCQ/ASSCH, antisymmetrically coupled SCD/SCQ/SCH modes.
    Fig. 5. Mode analysis based on PEMs for (a)–(d) Sample I and (e)–(h) Sample II. D, dipole-like; Q, quadrupole-like; H, hexapole-like; O, octopole-like charge distributions; SCD/SCQ/SCH/SCO, symmetrically coupled dipole-like/quadrupole-like/hexapole-like/octopole-like charge distributions; ASSCD/ASSCQ/ASSCH, antisymmetrically coupled SCD/SCQ/SCH modes.
    Mode analysis based on PEMs for Sample II′.
    Fig. 6. Mode analysis based on PEMs for Sample II.
    Mode analysis based on PEMs for (a) Sample V and (b) Sample VI. The square and circle in (a) correspond to the positions of modes 2 and 3, respectively.
    Fig. 7. Mode analysis based on PEMs for (a) Sample V and (b) Sample VI. The square and circle in (a) correspond to the positions of modes 2 and 3, respectively.
    TypeStructural OperatorMode OperatorSymmetry Dependency
    Plasmonic atomsGrowthExpansionaAsymmetrical
    CrossoverPreservationbSymmetrical
    Mutationb
    Plasmonic moleculesGroupPreservationcNone
    LearningaAsymmetrical
    Table 1. Summarization of MEM for Plasmonic Atoms and Molecules
    Liyong Jiang, Jianli Jiang, Zebin Zhu, Guanghui Yuan, Ming Kang, Ze Xiang Shen. Plasmonic evolution maps for planar metamaterials[J]. Photonics Research, 2021, 9(1): 73
    Download Citation