
Gao-Jian Zhang, Yi-Pu Wang. Observation of the anisotropic exceptional point in cavity magnonics system [J]. Acta Physica Sinica, 2020, 69(4): 047103-1
- Acta Physica Sinica
- Vol. 69, Issue 4, 047103-1 (2020)
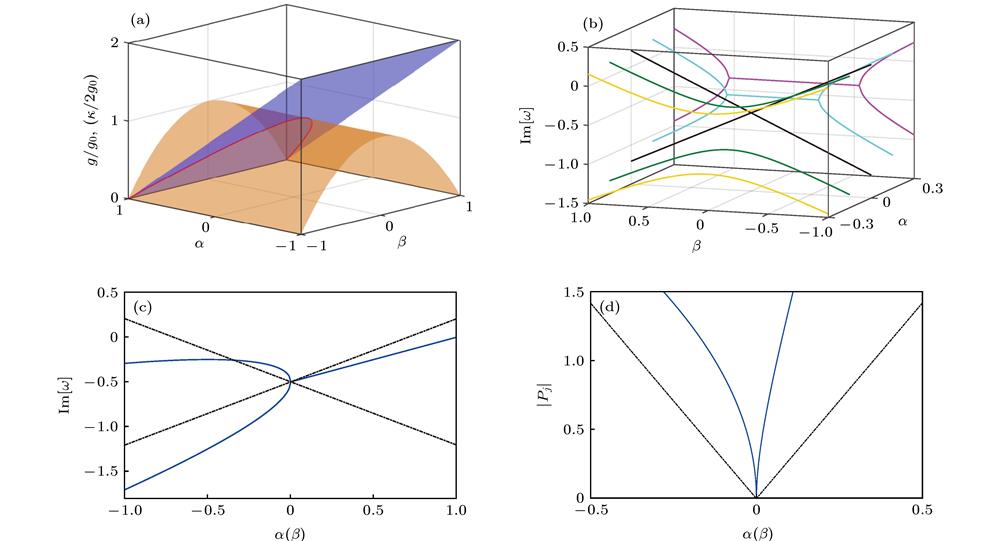
Fig. 1. (a) The normalized coupling constant
 and normalized loss difference
 in the parameter space
 are shown by the yellow and green surfaces, respectively. The solid red line corresponds to a line of EPs; (b) the imaginary part of the eigenfrequencies in the parameter space as a function of
 and
and
 , where the black solid line crossing is the position of the anisotropic EP; (c) imaginary part of the eigenfrequencies along
 adjusting direction (solid line) and
 adjusting direction (dotted line), respectively; (d) phase rigidity of the corresponding states along
 adjusting direction (solid line) and
 adjusting direction (dotted line), respectively. The parameters used are
 and
and
 .
.
and normalized loss difference
in the parameter space
are shown by the yellow and green surfaces, respectively. The solid red line corresponds to a line of EPs; (b) the imaginary part of the eigenfrequencies in the parameter space as a function of
and
, where the black solid line crossing is the position of the anisotropic EP; (c) imaginary part of the eigenfrequencies along
adjusting direction (solid line) and
adjusting direction (dotted line), respectively; (d) phase rigidity of the corresponding states along
adjusting direction (solid line) and
adjusting direction (dotted line), respectively. The parameters used are
and
. 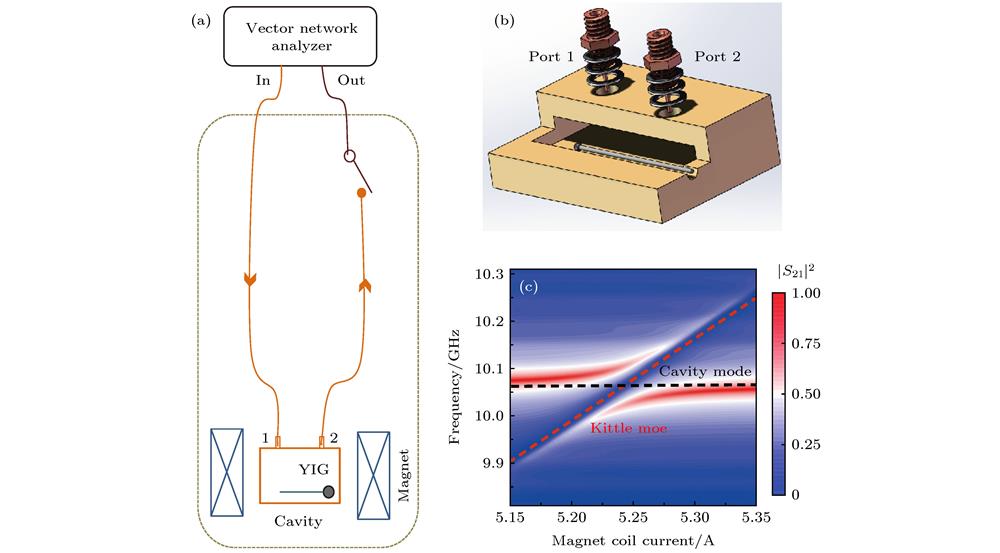
Fig. 2. Schematic of the experiment setup. The 3D cavity containing the YIG sphere is placed in the static magnetic field generated by a double-yoke double-tuned electromagnet which can be accurately adjusted at room temperature, and the transmission spectrum of the cavity is measured by network analyzer; (b) the YIG sphere is attached to a fiberglass reinforced plastic rod and inserted into a 3D rectangular cavity through a 4 mm hole on one side of the cavity. Ports 1 and 2 are used to obtain the transmission spectrum of cavity modes; (c) transmission spectrum of coupled system as a function of the current of the electromagnet coil(the magnitude of the biased magnetic field) and the probe field frequency. When the cavity mode and Kittle mode are resonant, the normal mode splitting equals to
 = 16.9 MHz.
= 16.9 MHz. Fig. 3. (a) The coherent coupling strength as a function of the position of the YIG sphere in the cavity, and the triangle dots the experimental results. The black solid curve is the result of theoretical fitting of experimental data. Among them, crimson, yellow and green dots indicate the coupling strengthes equal to: 8.17, 5.54 and 3.47 MHz, respectively; (b) the damping rate
 of the 3D cavity as a function of the number of gaskets y between the cavity and SMA connector, and the magenta dots represent the measured results. The solid blue line is the theoretical fitting curve.
of the 3D cavity as a function of the number of gaskets y between the cavity and SMA connector, and the magenta dots represent the measured results. The solid blue line is the theoretical fitting curve. Fig. 4. (a)Transmission spectra measured under three different damping rates of the cavity. All the solid lines are calculated using the input-output theory. The damping rates of the cavity mode are 15.64, 18.19 and 21.32 MHz, respectively.
Fig. 5. (a) Imaginary part of the eigenfrequencies as a function of the position x of the YIG sphere in the cavity with different number of gaskets. The solid curves are calculated using the coupling strengthes and the damping rates of the cavity modes obtained from the previous experiments (see Fig. 3 ), and the dots are obtained from the experimental data shown in Fig. 4 ; (b) imaginary part of the eigenfrequencies is plotted by black dotted line, indigo line and blue line when the number of gaskets are 6, 4 and 2, respectively. The black dotted line shows the linear crossing behavior; (c) when the coupling strength of the system is
 = 8.45 MHz, imaginary part of the eigenfrequencies are plotted as function of the gaskets
 y . The solid line is the result of theoretical calculation and the magenta square dots are the experimental results.
= 8.45 MHz, imaginary part of the eigenfrequencies are plotted as function of the gaskets 
Set citation alerts for the article
Please enter your email address
© Copyright 2018-2021 | Chinese Laser Press. All Rights Reserved 沪ICP备15018463号-20