• Acta Optica Sinica
  • Vol. 38, Issue 12, 1214002 (2018)
Luna Ying* and Weidong Zhou*
Author Affiliations
  • Institute of Information Optics, Zhejiang Normal University, Jinhua, Zhejiang 321004, China
  • show less
    DOI: 10.3788/AOS201838.1214002 Cite this Article Set citation alerts
    Luna Ying, Weidong Zhou. Comparative Analysis of Multiple Chemometrics Methods in Application of Laser-Induced Breakdown Spectroscopy for Quantitative Analysis of Soil Elements[J]. Acta Optica Sinica, 2018, 38(12): 1214002 Copy Citation Text show less
    Experimental device
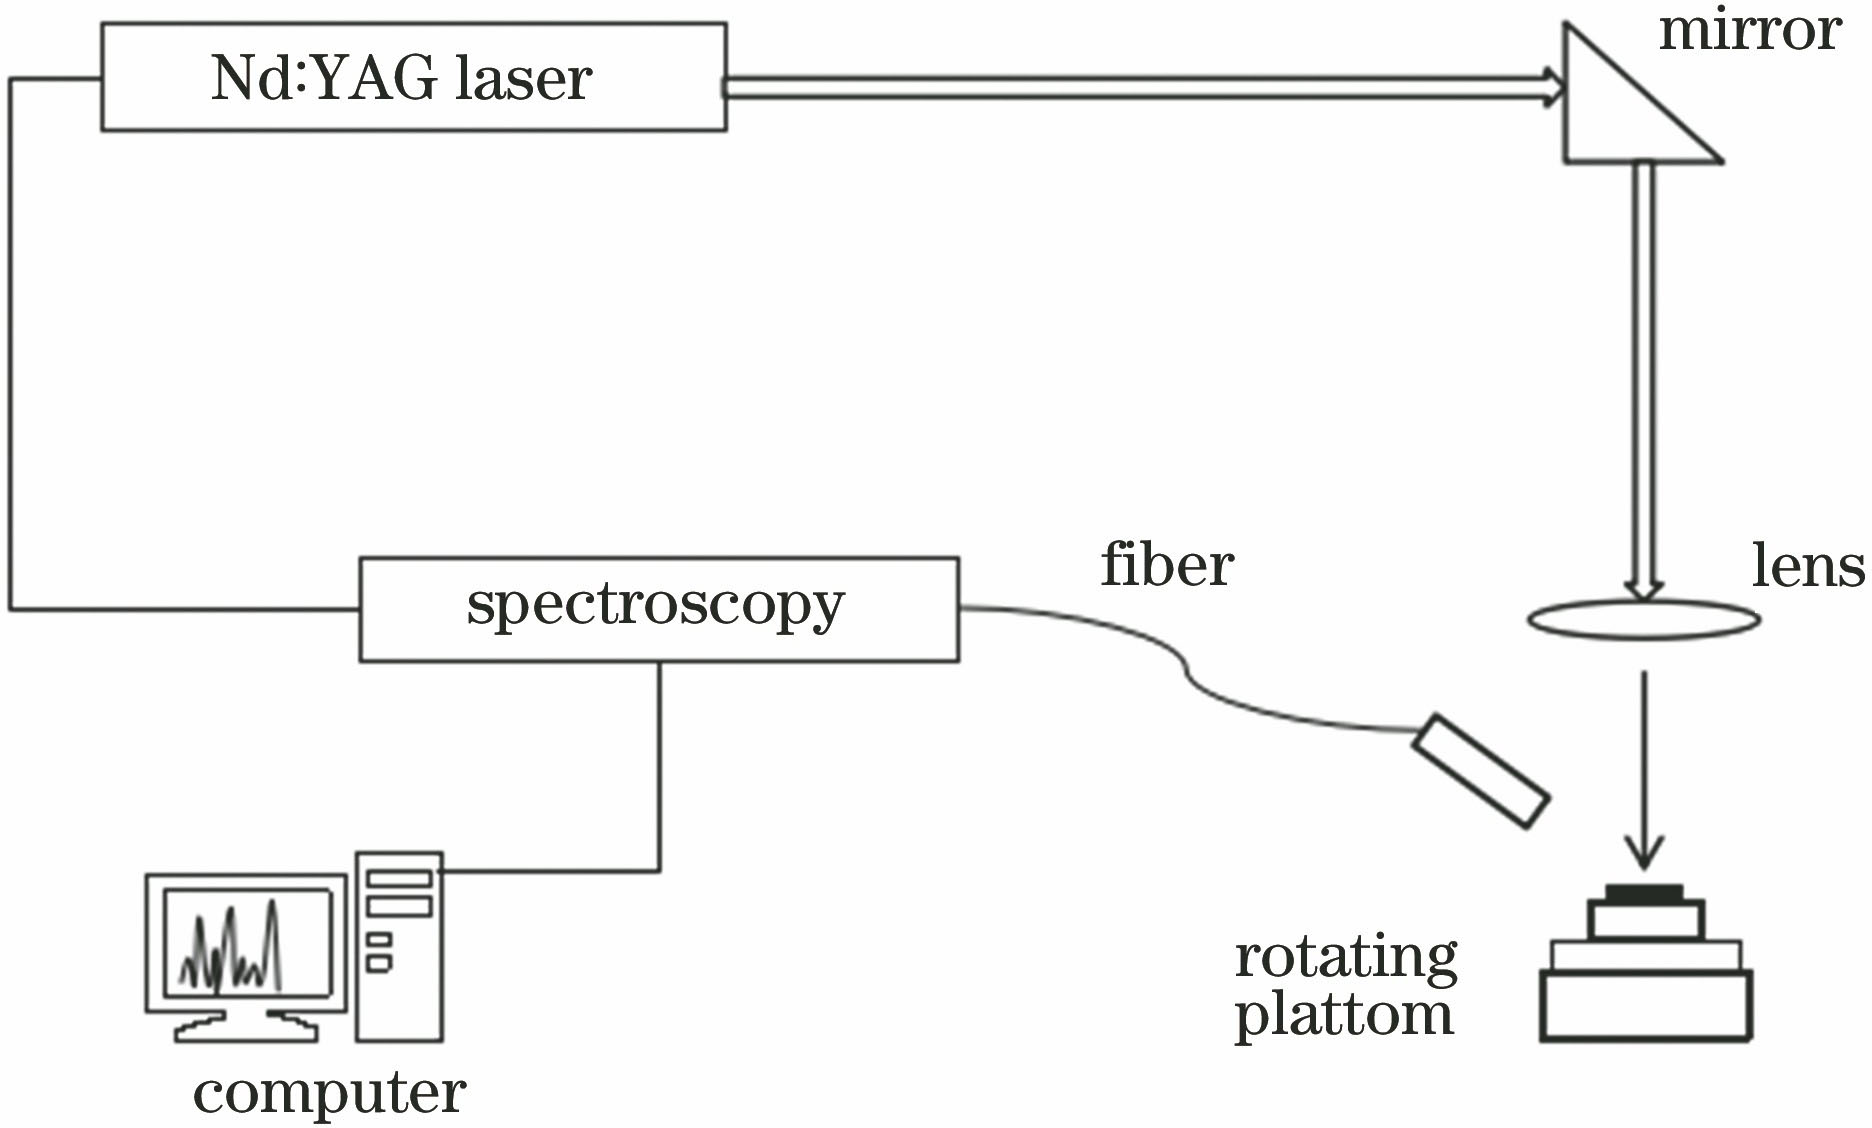
    Fig. 1. Experimental device
    Prediction results of different models at different analysis lines. (a) Ni I 325.074 nm; (b) Ni II 237.542 nm; (c) Ni I 236.063 nm; (d) Ni I 234.554 nm
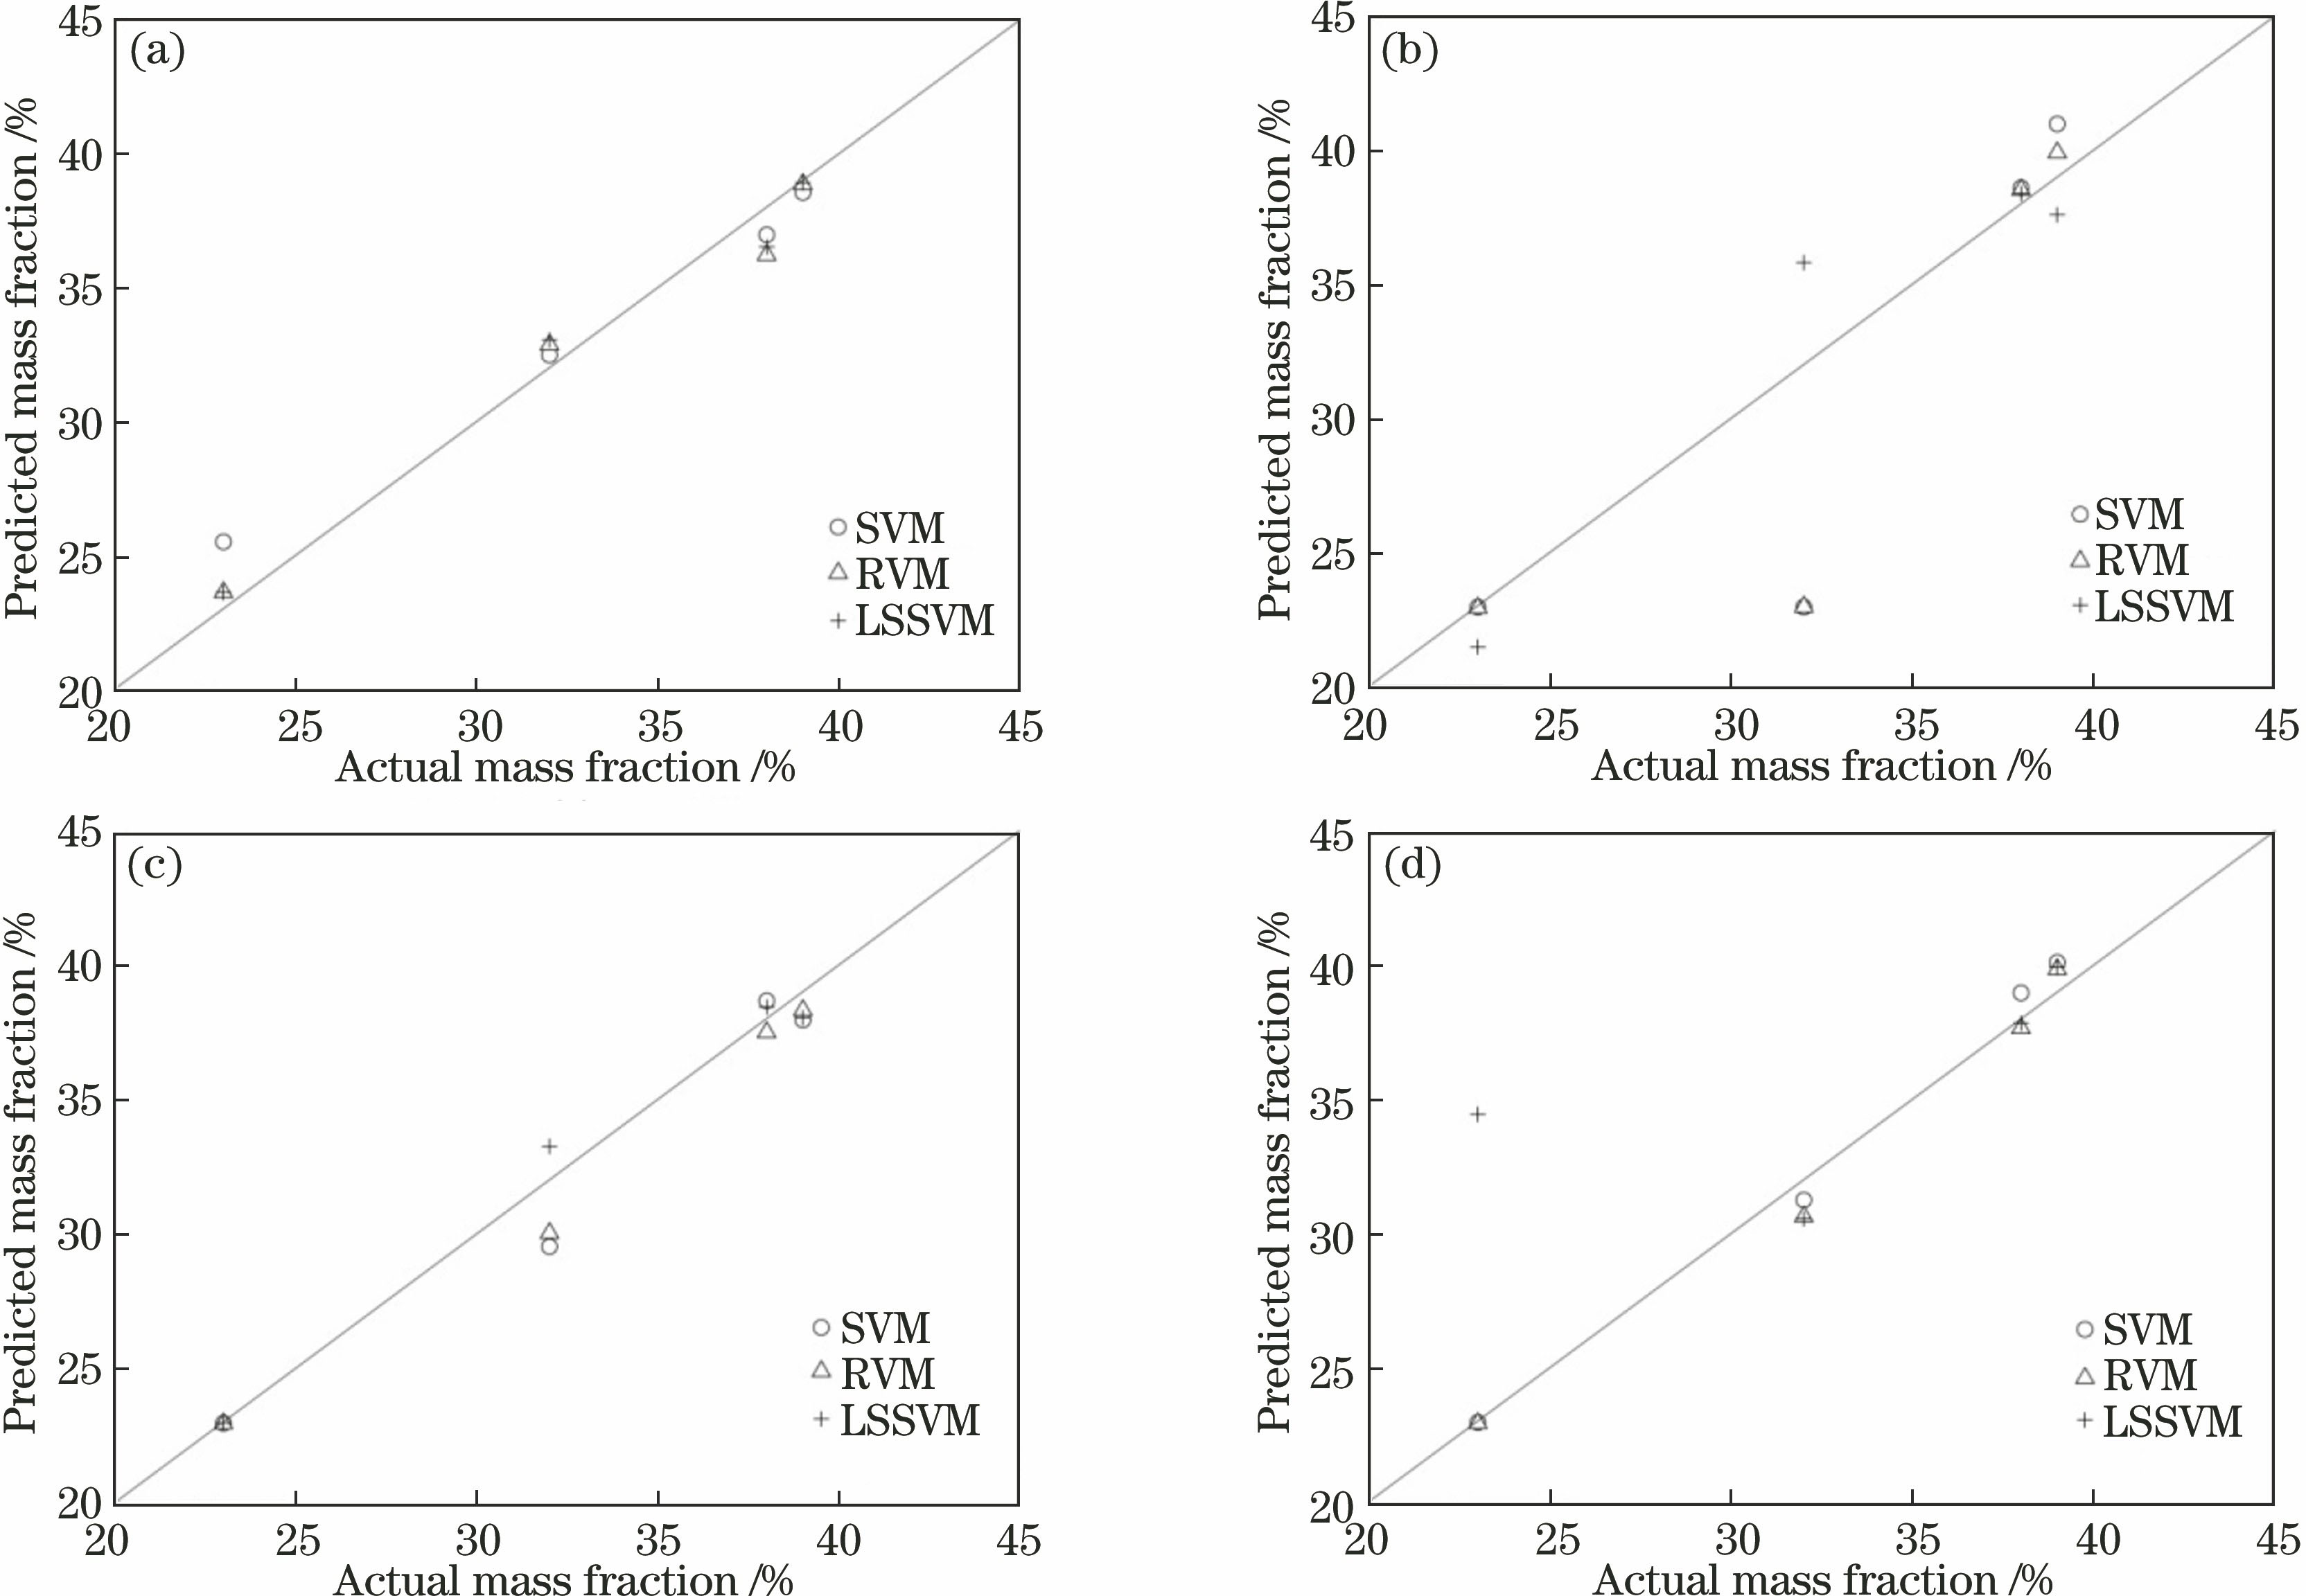
    Fig. 2. Prediction results of different models at different analysis lines. (a) Ni I 325.074 nm; (b) Ni II 237.542 nm; (c) Ni I 236.063 nm; (d) Ni I 234.554 nm
    Relative error of different analysis linesat different models. (a) Ni I 325.074 nm; (b) Ni II 237.542 nm; (c) Ni I 236.063 nm; (d) Ni I 234.554 nm
    Fig. 3. Relative error of different analysis linesat different models. (a) Ni I 325.074 nm; (b) Ni II 237.542 nm; (c) Ni I 236.063 nm; (d) Ni I 234.554 nm
    No.ComponentMass fraction ofNi /%
    1GBW0741923
    2GBW07419+GBW0742123
    3GBW07421+GBW07419+GBW0742929
    4GBW07419+GBW0742932
    5GBW07421+GBW07406+GBW0741933
    6GBW07406+GBW0741938
    7GBW07406+GBW0742139
    8GBW07406+GBW07419+ GBW0742941
    9GBW0742947
    10GBW0740653
    11GBW0742138
    12GBW07421+GBW0742923
    13GBW07421+GBW07406+GBW0742932
    14GBW07406+GBW0742939
    Table 1. Mass fraction of Ni in soil samples
    Analysis lineSample typeSVMRVMLSSVM
    No.10.0783317660.0694847860.063353712
    Ni I 325.074 nmNo.20.3270158590.3705290720.369579787
    No.30.1340496950.1191520630.113113412
    No.40.0456268730.0597866870.056680080
    No.10.0553889230.0279277830.036459557
    Ni II 237.542 nmNo.20.3877224610.3885986520.070682570
    No.30.1621621620.1758589560.178807775
    No.40.0947874480.0859212510.087760117
    No.10.0592132490.0287627700.049861180
    Ni I 236.063 nmNo.20.3877224610.3882172190.387763344
    No.30.2083010690.1920035610.107019250
    No.40.0276944620.0396339400.032492220
    No.10.0573329820.0483964260.049712195
    Ni I 234.554 nmNo.20.3877224610.3884603780.429558531
    No.30.3877224610.3873538540.032203699
    No.40.1107778460.0858748420.026812435
    Table 2. RSD of predictionresults of different analysis lines at different models
    ModelIndexNi I 325.074 nmNi I 234.554 nmNi I 236.063 nmNi II 237.542 nm
    SVMGRMSE0.1602230590.075213980.0968798960.279897941
    R20.75560.83750.93950.845
    RVMGRMSE0.1149702840.0654714040.0695244040.274357387
    R20.8780.99520.98390.9927
    LSSVMGRMSE0.1010480520.3519881970.0690657640.139595171
    R20.87830.91250.97840.9919
    Table 3. Global root mean square error and correlation coefficient of different analysis lines at different models
    Luna Ying, Weidong Zhou. Comparative Analysis of Multiple Chemometrics Methods in Application of Laser-Induced Breakdown Spectroscopy for Quantitative Analysis of Soil Elements[J]. Acta Optica Sinica, 2018, 38(12): 1214002
    Download Citation