• Photonics Research
  • Vol. 9, Issue 11, 2303 (2021)
Yang Ren* and Vien Van
Author Affiliations
  • Department of Electrical and Computer Engineering, University of Alberta, Edmonton, Alberta T6G 2W3, Canada
  • show less
    DOI: 10.1364/PRJ.437576 Cite this Article Set citation alerts
    Yang Ren, Vien Van. Ultrawide-band silicon microring avalanche photodiode with linear photocurrent-wavelength response[J]. Photonics Research, 2021, 9(11): 2303 Copy Citation Text show less
    (a) Design of the MR APD and (b) schematic of the Si rib waveguide embedded with a p+pn+ junction; (c) optical microscope image of the MR APD.
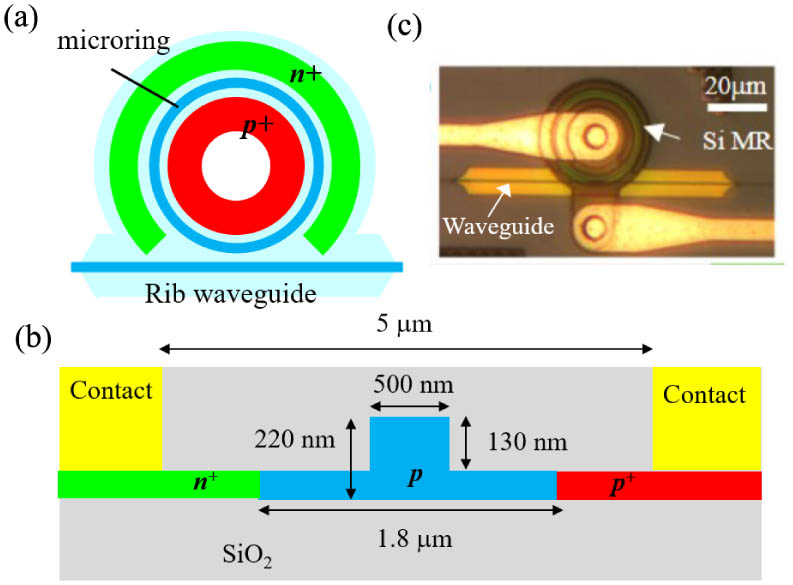
    Fig. 1. (a) Design of the MR APD and (b) schematic of the Si rib waveguide embedded with a p+pn+ junction; (c) optical microscope image of the MR APD.
    (a) Linear resonance transmission spectrum of the microring at 0 V bias (∼100 μW input optical power); (b) measured and simulated dark current-voltage characteristics of the MR APD under reverse bias. The simulated current did not account for impact ionization. (c) Simulated electric field profiles across the p+pn+ junction in the SOI waveguide. The upper panel shows the optical mode in the waveguide.
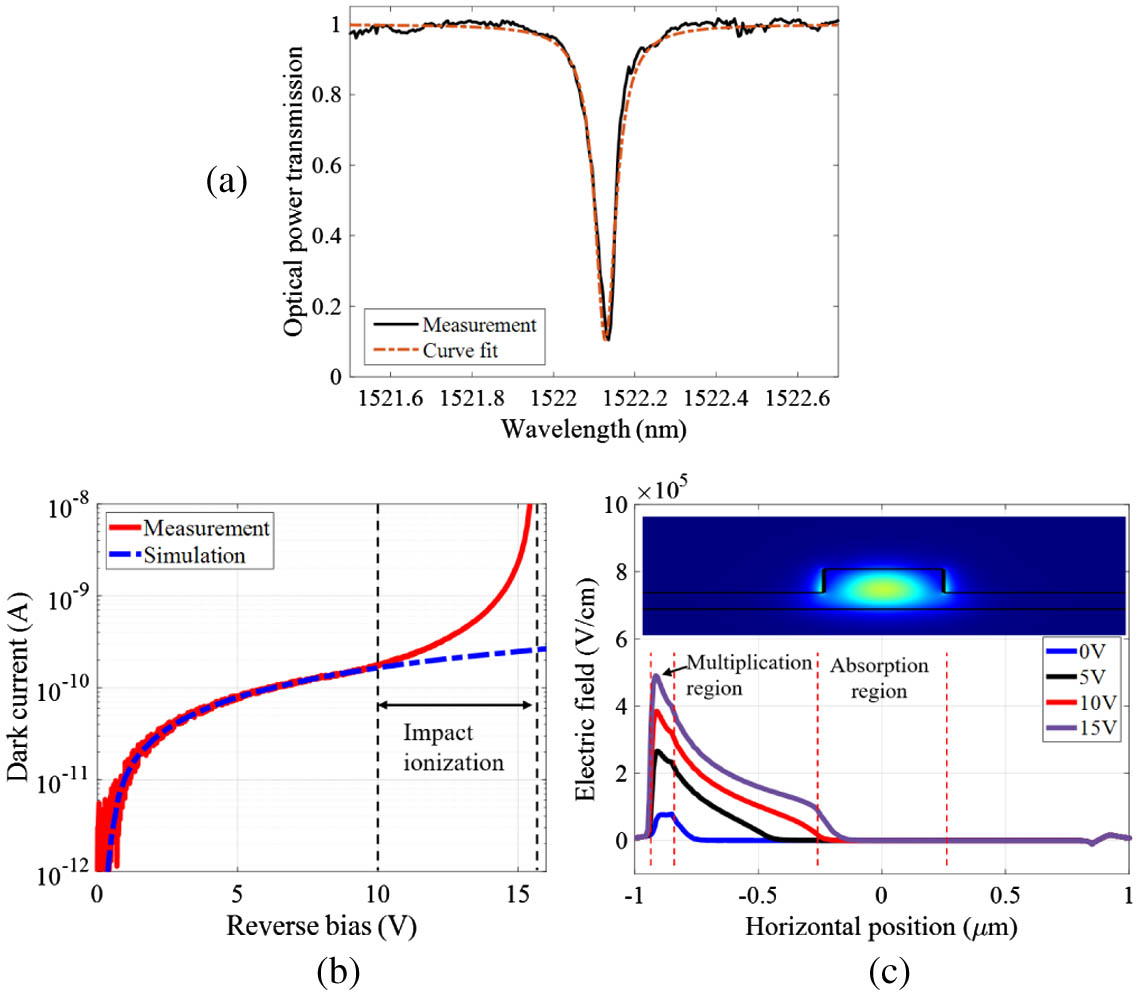
    Fig. 2. (a) Linear resonance transmission spectrum of the microring at 0 V bias (100  μW input optical power); (b) measured and simulated dark current-voltage characteristics of the MR APD under reverse bias. The simulated current did not account for impact ionization. (c) Simulated electric field profiles across the p+pn+ junction in the SOI waveguide. The upper panel shows the optical mode in the waveguide.
    Optical transmission spectra of the MR APD near the 1522.2 nm resonance for increasing input optical powers at reverse bias voltage (a) Vb=0 V and (b) Vb=15 V; corresponding photocurrent spectra at (c) 0 V and (d) 15 V bias voltage.
    Fig. 3. Optical transmission spectra of the MR APD near the 1522.2 nm resonance for increasing input optical powers at reverse bias voltage (a) Vb=0  V and (b) Vb=15  V; corresponding photocurrent spectra at (c) 0 V and (d) 15 V bias voltage.
    (a) Plot of the total loss coefficient α versus peak optical power Pr,max in the microring at reverse bias voltages of 0, 13, and 15 V; (b) dependence of the peak photocurrent Iph,max on the peak power Pr,max; dotted lines are best-curve fits of the log-log plots with slope m. (c) Linear dependence of the nonlinear phase ϕNL* on the peak photocurrent Iph,max at 13 V and 15 V bias voltages. Inset plot shows the curve for 0 V bias.
    Fig. 4. (a) Plot of the total loss coefficient α versus peak optical power Pr,max in the microring at reverse bias voltages of 0, 13, and 15 V; (b) dependence of the peak photocurrent Iph,max on the peak power Pr,max; dotted lines are best-curve fits of the log-log plots with slope m. (c) Linear dependence of the nonlinear phase ϕNL* on the peak photocurrent Iph,max at 13 V and 15 V bias voltages. Inset plot shows the curve for 0 V bias.
    Variations of the photocurrent with wavelength of the MR APD at 15 V reverse bias voltage; black curve is the response at low input optical power (46 μW) multiplied by a factor of 10 to make it visible; red and green curves are the responses at high input optical power (1.86 mW) obtained from forward and reverse wavelength scans, respectively. The dotted line is the best linear fit to the forward photocurrent spectrum over the 1518.5–1522.5 nm wavelength range.
    Fig. 5. Variations of the photocurrent with wavelength of the MR APD at 15 V reverse bias voltage; black curve is the response at low input optical power (46 μW) multiplied by a factor of 10 to make it visible; red and green curves are the responses at high input optical power (1.86 mW) obtained from forward and reverse wavelength scans, respectively. The dotted line is the best linear fit to the forward photocurrent spectrum over the 1518.5–1522.5 nm wavelength range.
    Peak responsivity and ratio of the peak photocurrent to dark current of the MR APD as functions of the input optical power at 13 and 15 V reverse bias voltages.
    Fig. 6. Peak responsivity and ratio of the peak photocurrent to dark current of the MR APD as functions of the input optical power at 13 and 15 V reverse bias voltages.
    Detected photocurrent waveform (converted to voltage) for a square-wave optical input signal of 1 MHz frequency; lower panels are the zoomed-in views of the rising and falling edges of the waveform.
    Fig. 7. Detected photocurrent waveform (converted to voltage) for a square-wave optical input signal of 1 MHz frequency; lower panels are the zoomed-in views of the rising and falling edges of the waveform.
    Yang Ren, Vien Van. Ultrawide-band silicon microring avalanche photodiode with linear photocurrent-wavelength response[J]. Photonics Research, 2021, 9(11): 2303
    Download Citation