Author Affiliations
1Department of Physics and Jiangsu Key Laboratory for Numerical Simulation of Large Scale Complex Systems, Nanjing Normal University2Department of Physics and Jiangsu Key Laboratory for Numerical Simulation of Large Scale Complex Systems, Nanjing Normal University, Nanjing 210023, China1Department of Physics, Nanjing University1Department of Physics, Nanjing University, Nanjing 210093, China2Joint Center for Particle, Nuclear Physics and Cosmology3Joint Center for Particle, Nuclear Physics and Cosmology, Nanjing 210093, China3State Key Laboratory of Theoretical Physics, Institute of Theoretical Physics4State Key Laboratory of Theoretical Physics, Institute of Theoretical Physics, CAS, Beijing 100190, Chinashow less
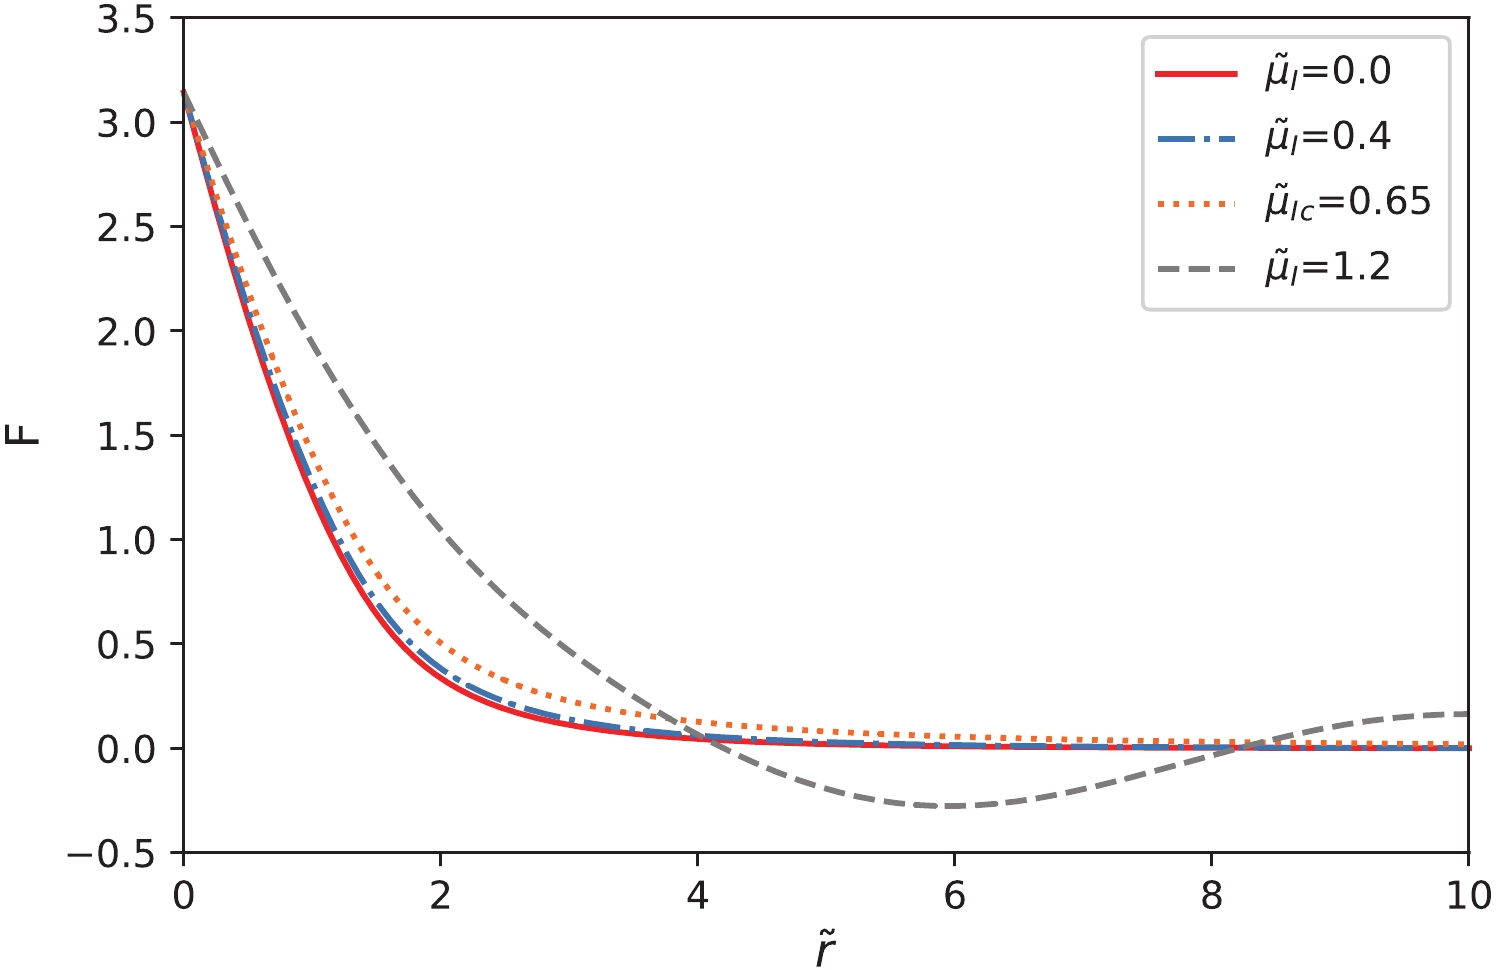
Fig. 1. (color online) Hedgehog profiles
for various values of the isospin chemical potential
. The profiles
are the exact solutions of Eq. (8) except the gray dashed curve. The red solid curve represents the solution for the isospin chemical potential
, the blue dot-dashed curve is for
, and the yellow dotted curve for
. The gray dashed curve, which behaves as a spherical Bessel function at large distances, is for
, which is larger than the critical isospin chemical potential
, but is not a soliton solution which has localized finite energy. It is clearly seen that the isospin chemical potential has a distinct influence on the profile
when
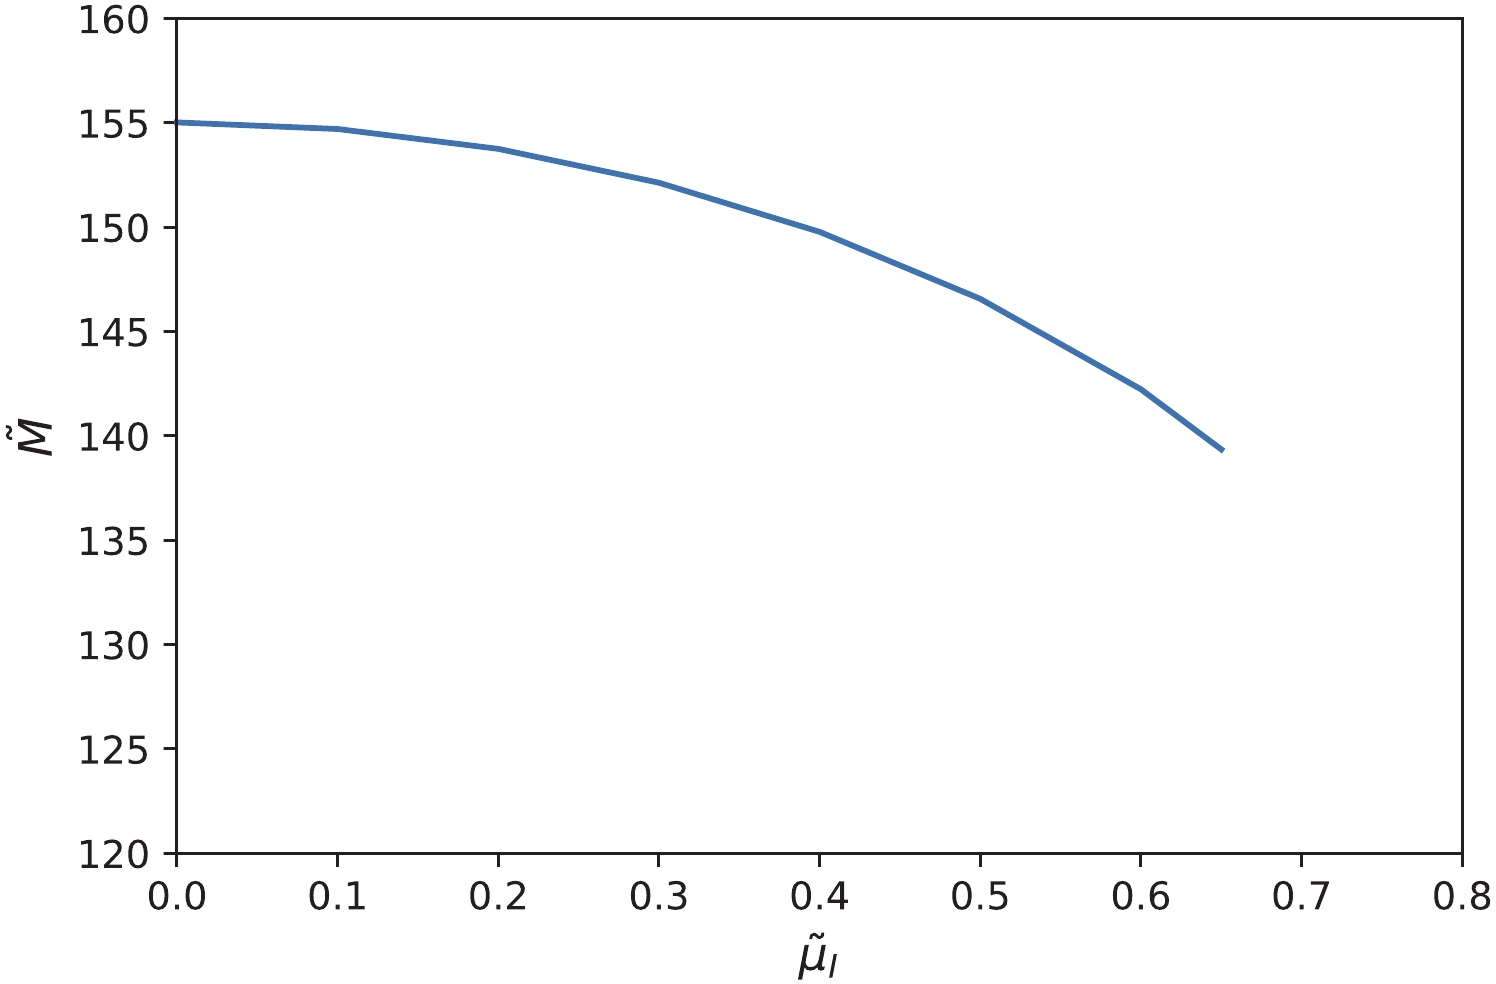
Fig. 2. (color online) The soliton mass as a function of the isospin chemical potential
for the spherically symmetric hedgehog ansatz. For
, the soliton mass is almost stable, while for
the soliton mass decreases with the increase of the isospin chemical potential. The curve stops at
, which is close to
.
Fig. 3. (color online)
as a function of
. For the isospin chemical potential
, the rms radius (the blue solid curve) diverges, which suggests the occurrence of a phase transition.
Fig. 4. (color online)
as a function of
. For isospin chemical potential larger than
, the rms radius diverges.
Fig. 5. (color online) The baryon number density
as a function of
for typical values of the isospin chemical potential. The red solid curve is for the isospin chemical potential
, the blue dot-dashed curve for
, and the purple dashed curve for
.
Fig. 6. (color online) The skyrmion thermal profile F as a function of
at finite temperature and zero isospin chemical potential. The red solid curve is for the temperature
, the blue dashed curve for
, and the purple dotted curve for
. Note that
is the critical temperature when the isospin chemical potential is zero.
Fig. 7. (color online) The soliton mass
as a function of
in the spherically symmetric hedgehog ansatz and for
. The blue solid curve is the soliton mass for
(
MeV); the minimum
(
MeV) is at
. The orange dashed curve is for
(
MeV) with the minimum
at
. The green dot-dashed line is for the critical temperature
(
=
MeV) where the minimum does not exist.
Fig. 8. (color online) The dependence of the critical temperature
on the isospin chemical potential
in the spherically symmetric hedgehog ansatz.