• Journal of Geographical Sciences
  • Vol. 30, Issue 8, 1307 (2020)
Zhilong ZHAO1、2, Xiuqi FANG1, Yu YE1、*, Chengpeng ZHANG1, and Diyang ZHANG1
Author Affiliations
  • 1Faculty of Geographical Science, Beijing Normal University, Beijing 100875, China
  • 2Key Laboratory of Land Surface Pattern and Simulation, Institute of Geographic Sciences and Natural Resources Research, CAS, Beijing 100101, China
  • show less
    DOI: 10.1007/s11442-020-1783-y Cite this Article
    Zhilong ZHAO, Xiuqi FANG, Yu YE, Chengpeng ZHANG, Diyang ZHANG. Reconstruction of cropland area in the European part of Tsarist Russia from 1696 to 1914 based on historical documents[J]. Journal of Geographical Sciences, 2020, 30(8): 1307 Copy Citation Text show less
    Location of the study area and the provincial-level units of ETR in 1900. The provincial boundary of ETR is cited from Gilbert (2012).
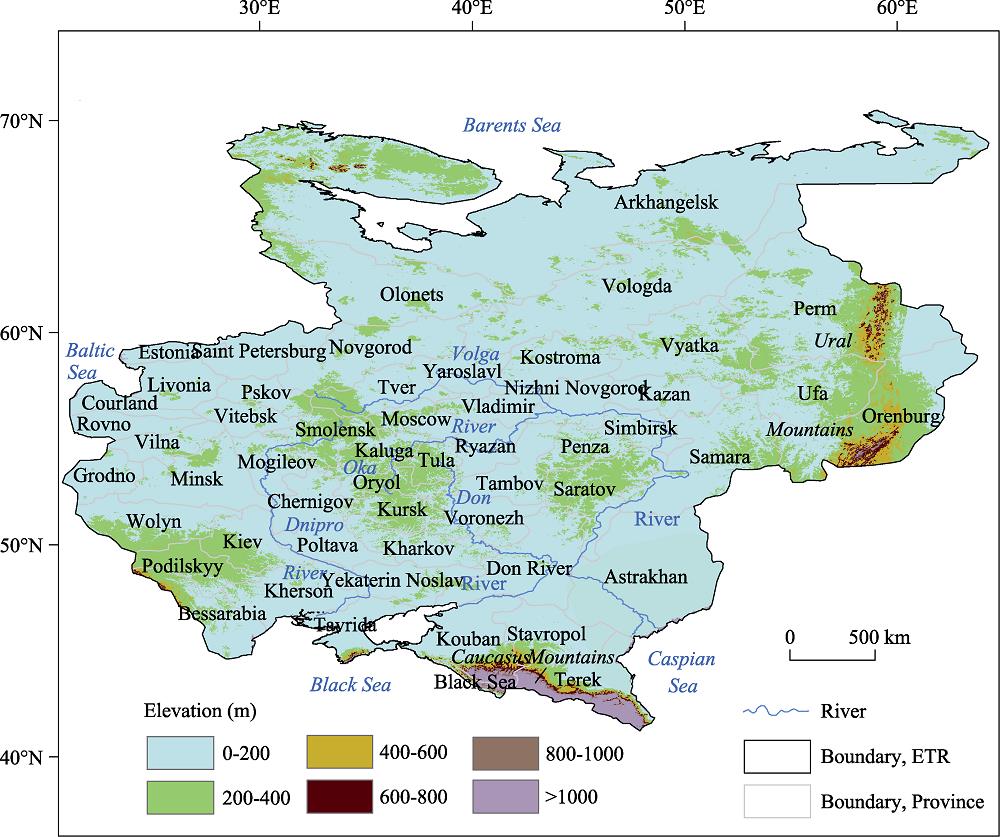
    Fig. 1. Location of the study area and the provincial-level units of ETR in 1900. The provincial boundary of ETR is cited from Gilbert (2012).
    Changes in cropland area, fractional cropland area and per capita cropland area of ETR during 1696-1914
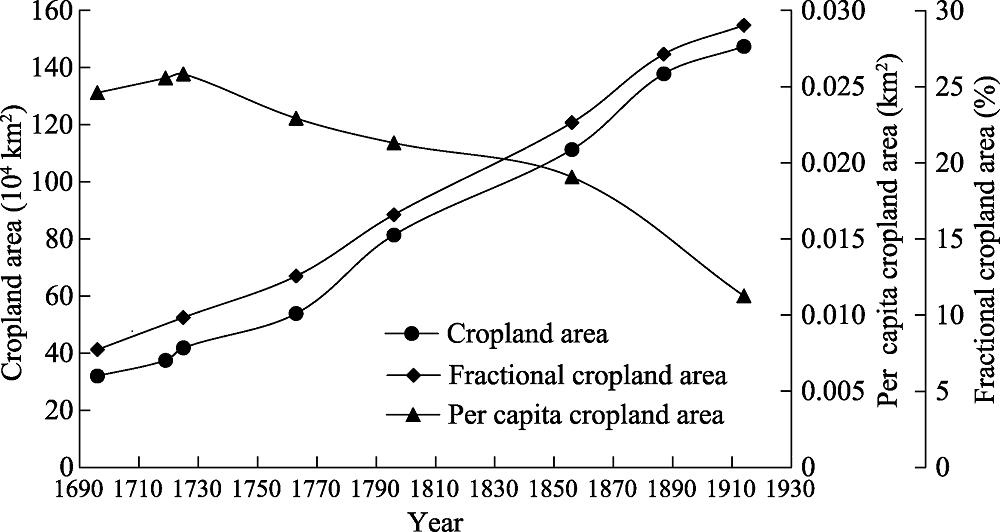
    Fig. 2. Changes in cropland area, fractional cropland area and per capita cropland area of ETR during 1696-1914
    Distribution of the provincial fractional cropland area in ETR during 1719-1914
    Fig. 3. Distribution of the provincial fractional cropland area in ETR during 1719-1914
    Changes of the provincial fractional cropland area in ETR during 1719-1914
    Fig. 4. Changes of the provincial fractional cropland area in ETR during 1719-1914
    Comparison of cropland area and per capita cropland area in ETR between this study and HYDE 3.2 from 1696 to 1914
    Fig. 5. Comparison of cropland area and per capita cropland area in ETR between this study and HYDE 3.2 from 1696 to 1914
    Time periodData content
    1696, 1725, 1763, 1796, 1856Total cropland area, total land area, total population
    1795Total land area
    1887, 1914Fractional cropland area, total land area
    1719, 1795, 1856, 1914Provincial population, sub-regional grain yield per unit area, provincial land area
    1711-1735, 1801-1810, 1851-1860, 1909-1913Total population
    Rural food and feed consumption, urban food and feed consumption, food exports, military food and feed consumption, food consumption in wine-making industry, seed consumption
    Table 1.

    The data of ETR used in this study

    Region
    Timethe black soil region in the central ETRsurrounding area of the Volga River and the vicinity of Uralnew Russia regionnorth Caucasus region
    1678-17826327
    1782-185896.8151
    1870-191543.8137.8198.3
    Table 2.

    The number of migrants to different regions in ETR from 1678 to 1915 (104 people)

    IndexTimeRegionValues in this study (Vs)Values in other literature (Vl)Difference(Di)
    Fractional cropland area1696ETR7.80%7.90% (Tsvetkov, 1957)0.10 percentiles
    18th centuryNizhni Novgorod32.41%32.30% (Kukushkina et al., 2018)-0.11 percentiles
    18th centuryTver16.79%15% (Karimov and Nosova, 1999)-1.79 percentiles
    18th centuryRyazan27.93%29.65% (Matasov, 2016)1.72 percentiles
    1795Yaroslavl, Vladimir and Ryazan42.73% (Yaroslavl)37.00% (Vladimir)42.47% (Ryazan)20%-75% (Alyabina et al., 2015)-
    1795Chernigov61.28%60% -75% (James and French, 1983)-
    1796ETR16.80%16.70% (Tsvetkov, 1957)-0.10 percentiles
    1914Estonia26.26%25% (Tomson et al., 2015) - 31% (Poska et al., 2014)-
    Lithuania49.54%43.62% (Li, 1981)-5.92 percentiles
    Latvia34.46%32.31% (Li, 1981)-2.15 percentiles
    Per capita food and feed consumption1856ETR345.15 kg349.88kg (Mironov, 2012)1.37%
    Cropland area1914Kherson48889.10 km246684.70 km2 (Kondratieff, 2017)-4.51%
    Saratov29348.85 km228229.00 km2(Mironov, 2012)-3.82%
    European Russia97.62 (104 km2)69.80-104.70 (104 km2) * (Li, 1981)-
    Ukraine32.23 (104 km2)27.95-41.93 (104 km2) * (Li, 1981)-
    Moldova2.90 (104 km2)2.07-3.11 (104 km2) * (Li, 1981)-
    Belarus5.55 (104 km2)4.54-6.81(104 km2) * (Li, 1981)-
    ETR1473955.78 km21449663.45 km2 (Kondratieff, 2017)-1.65%
    Table 3.

    Differences of fractional cropland area, per capita food and feed consumption, and cropland area in ETR from 1696 to 1914 between this study and other studies

    Zhilong ZHAO, Xiuqi FANG, Yu YE, Chengpeng ZHANG, Diyang ZHANG. Reconstruction of cropland area in the European part of Tsarist Russia from 1696 to 1914 based on historical documents[J]. Journal of Geographical Sciences, 2020, 30(8): 1307
    Download Citation