Zhilong ZHAO, Xiuqi FANG, Yu YE, Chengpeng ZHANG, Diyang ZHANG. Reconstruction of cropland area in the European part of Tsarist Russia from 1696 to 1914 based on historical documents[J]. Journal of Geographical Sciences, 2020, 30(8): 1307
Copy Citation Text
To evaluate the climatic and ecological impacts of anthropogenic activities in global change research, it is essential to reconstruct historical land use and land cover change on regional and global scales. In this study, we reconstructed cropland areas for 54 provinces within the European part of Tsarist Russia (ETR) over the periods of 1696-1914 using historical data, including cropland area, population, grain consumption, and grain yield per unit area. The main results are as follows. (1) Total cropland areas and fractional cropland areas of ETR for 8 time sections during 1696-1914 were reconstructed, the former increased from 31.98×10⁴ km2 to 147.40×10⁴ km2, and the latter increased from 7.89% to 29.20%. The per capita cropland area decreased from 0.0246 km2 to 0.0113 km2 during 1696-1914. (2) Cropland expanded from the central and southwestern ETR to the black soil region, surrounding area of the Volga River, Ukraine region, the new Russia region, the vicinity of Ural, and north Caucasus region. (3) The expansion of territory, increase and migration of population, policies related to agricultural development and foreign trade, and the impacts of climate change were the reasons for the changes in cropland within ETR from 1696 to 1914. (4) In 1914, the cropland area and fractional cropland area of each province varied from 0.16×10⁴ km2 and 0.76% to 5.65×10⁴ km2 and 76.68%, respectively. (5) The comparisons show that the cropland areas of ETR in this study for 1696-1914 are higher than those in the HYDE 3.2 dataset. The main reason for this finding might be the underestimation of per capita cropland areas in the HYDE 3.2 dataset, which values remained at approximately 0.01 km2 from 1700 to 1920.
As one of the human induced global environmental changes, anthropogenic land use and land cover change (LUCC) has dramatically modified the Earth's surface (Sterling et al., 2012; Mooney et al., 2013; Tian et al., 2014; Santana-Cordero et al., 2016), and significantly influenced global and regional climate change and carbon cycle through biogeochemical and biogeophysical mechanisms (Pongratz et al., 2010; Ellis et al., 2013; Su and Fu, 2013; Tao et al., 2013; Salazar et al., 2015; Cao et al., 2016; Gaillard et al., 2017; Houghton and Nassikas, 2017). At present, approximately 12.2% of the land surface area has been converted into cropland (Klein Goldewijk et al., 2017) which has been an important contributor to global greenhouse gas emissions (Smith et al., 2014). To reconstruct historical cropland cover change could not only improve our understanding on the anthropogenic roles in historical land cover changes and climate changes (IGBP, 2009; Zhang et al., 2013), but also help us cope with the challenges of environmental problems created by land cover conversion (Kaplan et al., 2012; Li et al., 2013; Fuchs et al., 2015; Li et al., 2018).
Over the past decades, a number of international research projects, such as the Land Use/Cover Change Project, the Global Land Programme and the LandCover 6k, have been implemented to promote the historical LUCC reconstruction. Several representative global datasets on historical land cover have been developed, for example, the History Database of the Global Environment (HYDE) (Klein Goldewijk et al., 2017), Global Land Use Database of the Center for Sustainability and the Global Environment (SAGE) (Ramankutty and Foley, 1999), KK10 dataset (Kaplan et al., 2011), and PJ dataset (Pongratz et al., 2008). Although these datasets have been widely applied to analyze the relationship between land cover change and climate change, ecosystem services and carbon emissions over past (Li et al., 2013; Jantz et al., 2015; Simmons and Matthews, 2016; Smith et al., 2016), there are many uncertainties in each dataset and disagreements among these datasets in both the total amount and spatial distribution for each land cover type on regional and even global scales (Pongratz et al., 2008; Klein Goldewijk et al., 2011; Ye and Fang, 2011; Li et al., 2013; Ye et al., 2015; Kaplan et al., 2017). For example, the global cropland area of 1992 in PJ dataset is approximately 24% more than that in HYDE dataset (Klein Goldewijk et al., 2011); it has been evinced that large uncertainties of the global datasets existed on regional scales by many regional scale reconstructions which are more likely to be the real historical LUCC (Ye and Fang, 2011; Li et al., 2013; Ye et al., 2015; Kaplan et al., 2017). Thus, more and more reconstructions have been carried out on regional or local scales (Li et al., 2016; Wei et al., 2016; Yang et al., 2016; He et al., 2017; Li et al., 2017; Kukushkina et al., 2018). Such regions are generally the major agricultural regions of the world and have abundant historical materials to provide enough data of cropland, population, food consumption, and so on for historical cropland cover reconstruction. These regional reconstructions could not only provide a reference for evaluating the uncertainties of the cropland cover in the global datasets, but also be used to improve the accuracy of global datasets.
The history of agricultural reclamation in Russia originated in the period of 5000 BC-6000 BC (Kalesnik, 1978). Although the territory of Russia varied in the history, the cropland was mainly distributed in its European part. In the past 300 years, Russia was an important agricultural country in the world, and has exported grain to other countries within Europe for a long time (Kalesnik, 1978). The cropland area in modern Russia accounted for 8.11% of the total arable land area in 2015 in the world (Klein Goldewijk et al., 2017). A number of studies have reconstructed historical cropland areas and assessed their impact on carbon emissions in ETR (Tomson et al., 2015; Novenko et al., 2017; Chernova et al., 2018; Kukushkina et al., 2018). However, these studies encompassed only some small areas, and covered the period since the last quarter of the 18th century when historical documents about cropland cover are relatively plentiful, which limited the environmental effects of LUCC study for a long time period and a broad scale.
We have mined some historical data related to cropland use and cover such as population, cropland area, grain consumption, and grain yield per unit area in ETR since the late 17th century from historical materials, although historical records for this period are not as abundant as those since the late 18th century. Using the available historical data, a reconstruction of historical cropland area on regional and provincial scales of ETR during 1696-1914 has been made in this study. The results of this study could provide more regional reconstructions of historical LUCC over the past 300 years.
2 Materials and methods
2.1 Study Area
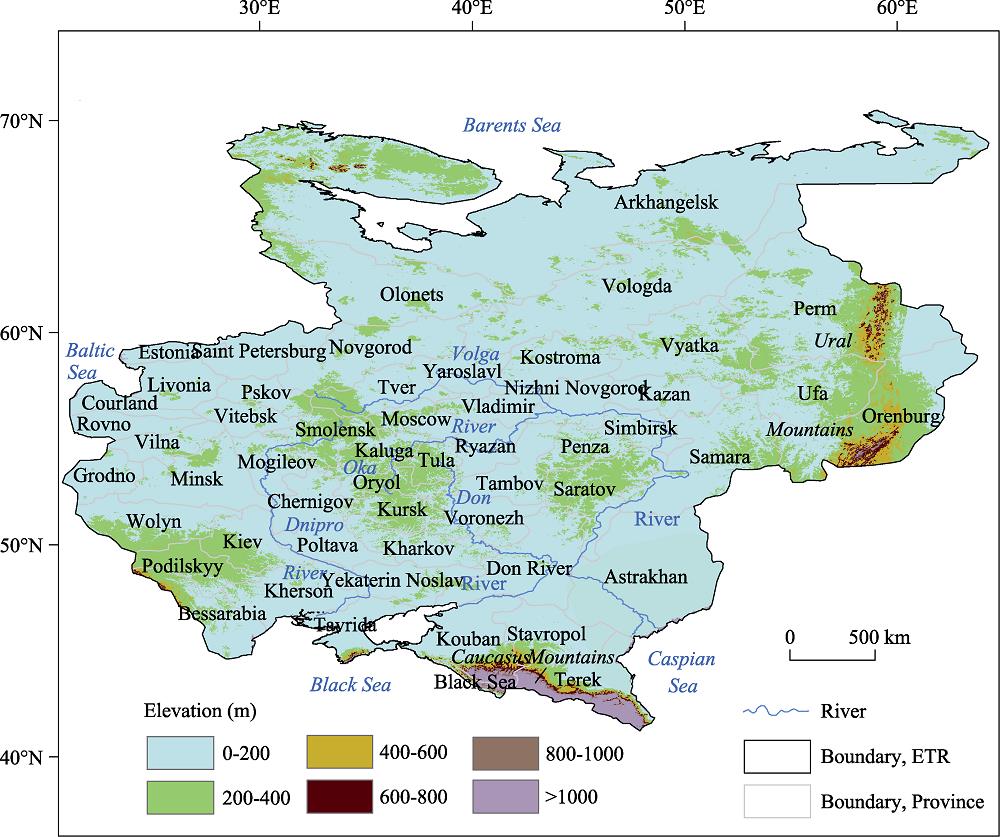
ETR (Figure 1) is a region located between 41°16′N-70°33′N and 20°43′E-64°19′E. The region covers an area of approximately 504.78×10⁴ km2 and includes the current European region of Russia and Estonia, Latvia, Lithuania, Belarus, Ukraine, and Moldova. The region is characterized by plain topography and by a temperate continental climate with average annual precipitation levels of 200 mm to 1000 mm.
Figure 1.
Location of the study area and the provincial-level units of ETR in 1900. The provincial boundary of ETR is cited from <xref ref-type="bibr" rid="b8">Gilbert (2012)</xref>.
ETR is one of the traditional agricultural regions in Europe. From the end of the 17th century to the early 20th century, ETR was ruled by the Russian Empire. The boundaries of ETR and its subdivisions changed frequently during this period. According to provincial administrative boundaries in the early 20th century (Mironov, 2012), a prior study reconstructed provincial populations of ETR in 1719, 1795, 1856 and 1914. To match the spatial resolution of these population data which will be used for reconstructing historical cropland area, we selected province as the basal administrative unit in this study. Based on the national and provincial boundaries of Russia in 1900, a total of 54 provincial-level units were therefore employed (Figure 1).
2.2 Data and methods
2.2.1 The data for cropland reconstruction
The data including cropland area, land area, population, grain consumption, grain yield per unit area, were used to reconstruct cropland cover on regional and provincial scales within ETR from 1696 to 1914. They were obtained from the Life History of the Tsarist Russia Age (Mironov, 2012) (Table 1).
Time period
Data content
1696, 1725, 1763, 1796, 1856
Total cropland area, total land area, total population
1795
Total land area
1887, 1914
Fractional cropland area, total land area
1719, 1795, 1856, 1914
Provincial population, sub-regional grain yield per unit area, provincial land area
1711-1735, 1801-1810, 1851-1860, 1909-1913
Total population
Rural food and feed consumption, urban food and feed consumption, food exports, military food and feed consumption, food consumption in wine-making industry, seed consumption
Based on these data, the cropland covers of ETR were reconstructed for 8 time sections (1696, 1719, 1725, 1763, 1796, 1856, 1887 and 1914). The cropland covers of the 54 provinces of ETR in 1719, 1795, 1856 and 1914 were also reconstructed.
2.2.2 Methods for reconstructing total cropland area of ETR
Considering the differences in the available data, total cropland areas and fractional cropland areas of ETR for 8 time sections during 1696-1914 were reconstructed in two ways.
(1) Interconversion between total cropland area and fractional cropland area
The fractional cropland area and the total cropland area of ETR could be interconverted by Equation (1).
${{F}_{i}}={{A}_{ci}}/{{A}_{li}}$
where Aci denotes the cropland area of ETR in the year of i, Ali denotes the total land area of ETR in the year of i, and Fi denotes the fractional cropland area of ETR in the year of i.
The fractional cropland areas of ETR for 1696, 1725, 1763, 1796 and 1856 were calculated from the available total cropland area by Equation (1).
The cropland areas of ETR in 1887 and 1914 were calculated from the available fractional cropland area by Equation (1).
In the calculation of the total cropland area of ETR in 1795, we assumed that the fractional cropland area of ETR in 1795 is the same as that in 1796. Thus, the cropland area of ETR in 1795 was calculated by Equation (1).
(2) Total cropland area inferred from the population
The available record that could be used to infer the cropland area in 1719 was population. We assumed that the change of per capita cropland area was approximately linear during 1696-1725. Thus, the cropland area of ETR in 1719 was calculated from the per capita cropland areas in 1696 and 1725 by Equation (2) (Wu and Ge, 2000; He et al., 2017).
where Ac1719 denotes the cropland area of ETR in 1719, Ac1725 denotes the cropland area of ETR in 1725, Ac1696 denotes the cropland area of ETR in 1696, Pt1719 denotes the total population of ETR in 1719, and it is equal to the sum of all provincial population in the year of 1719, Pt1725 denotes the total population of ETR in 1725, Pt1696 denotes the total population of ETR in 1696.
2.2.3 Method for reconstructing the provincial cropland area
The provincial cropland areas in the 4 time sections of 1719, 1795, 1856 and 1914 within ETR were calculated by downscaling the total cropland area of ETR in each section. The basic assumption of the calculation, which is weighted by provincial population, is that the amount of grain consumption over the four years listed above is equal to the amount of grain demand in those years. This assumption was widely used since the 1920s by the Central Bureau of Statistics of the Union of Soviet Socialist Republics in its work on grain statistics (Mironov, 2012). The calculation could be divided into three steps.
(1) To calculate the per capita food and feed consumption by Equation (3).
where ${{\bar{C}}_{i}}$ denotes the per capita food and feed consumption in the year of i, Cui denotes the urban food and feed consumption in the year of i, Cri denotes the rural food and feed consumption in the year of i, and Pti denotes the total population in the year of i.
In fact, instead of the data listed in Equation (3) for 1719, 1795, 1856 and 1914, we have only durational data covering or nearing the above-mentioned years. Thus, we used the data in the periods of 1711-1735, 1801-1810, 1851-1860 and 1909-1913 to represent the data in 1719, 1795, 1856 and 1914, respectively.
(2) To calculate the total grain consumption by Equation (4).
where Cti denotes the total grain consumption in the year of i, ${{\bar{C}}_{i}}$ represents the per capita food and feed consumption in the year of i calculated in step (1), $\Sigma {{P}_{pi}}$ denotes the sum of all provincial population in the year of i, Cei denotes the amount of food exports in the year of i, Cmi denotes the military food and feed consumption in the year of i, Cwi denotes the food consumption for wine-making industry in the year of i, and Csi denotes the seed consumption in the year of i.
We used the provincial population data in 1719, 1795, 1856 and 1914 to calculate $\Sigma {{P}_{pi}}$, respectively. For the other data listed in Equation (4), we also used the durational data in the periods of 1711-1735, 1801-1810, 1851-1860 and 1909-1913 to represent the data in 1719, 1795, 1856 and 1914, respectively.
(3) To calculate the provincial cropland area by Equation (5).
where Apik denotes the cropland area of province k in the year of i, Cti denotes the total grain consumption in the year of i calculated in step (2), $\Sigma {{P}_{pi}}$ represents the sum of all provincial population in the year of i, and Ppik denotes the population of province k in the year of i, Caik denotes the grain yield per unit area of province k in the year of i.
A total of 54 provinces within ETR were divided into 10 sub-regions in the book Life History of the Tsarist Russia Age (Mironov, 2012). This book also provided the grain yield per unit area of these 10 regions during 1719-1914. We used the grain yield per unit area of a sub-region that contains province k to represent the grain yield per unit area of province k. Then we calculated the cropland area of each province within ETR in the years of 1719, 1795, 1856 and 1914 by Equation (5).
2.2.4 Method for data comparison
To evaluate the credibility of the reconstructed results in this study, the fractional cropland area, cropland area, and food and feed consumption were compared with the available values in other published literatures.
The reconstructed regional LUCC dataset on the basis of historical materials is regarded as closer to the real cropland area in the history. It could be used to assess the accuracy of the global LUCC dataset. We compared the cropland cover reconstructed in this study with the cropland cover of HYDE, the global LUCC dataset. From 1696 to 1914, the temporal resolution of HYDE (Klein Goldewijk et al., 2017) was 10 years. We compared our findings for the cropland area, fractional cropland area, and per capita cropland area of ETR with those derived from the HYDE 3.2 dataset in the years closest to the 8 time sections.
Data comparison of the fractional cropland area, using Equation (6):
${{D}_{i}}={{V}_{l}}-{{V}_{s}}$
Data comparison of other indices except for the fractional cropland area, using Equation (7):
${{D}_{i}}=({{V}_{l}}-{{V}_{s}})/{{V}_{s}}$
where Di denotes the difference between the value obtained from this study and the value obtained by other literature in the period of i, Vl denotes the value in other literature, and Vs denotes the value in this study. When the differences are smaller, the data obtained from this study are closer to those in other literatures, which indicates that the data in results of this study are more reliable.
3 Results
3.1 Changes in cropland area of ETR during 1696-1914
The total cropland area and fractional cropland area of ETR increased simultaneously, while the per capita cropland area decreased in general, from 1696 to 1914. The changes could be divided into three phases (Figure 2).
Figure 2.
Changes in cropland area, fractional cropland area and per capita cropland area of ETR during 1696-1914
The first phase is from 1696 to 1763, when the total cropland area of ETR increased by 1.68 times from 31.98×10⁴ km2 to 53.87×10⁴ km2, and the fractional cropland area increased from 7.89% to 12.73% with an average annual growth rate of 0.07 percentiles. The per capita cropland areas increased slightly, from 0.0246 km2 in 1696 to 0.0258 km2 in 1725, and then decreased to 0.0229 km2 in 1763.
The second phase is from 1763 to 1887, when the total cropland area of ETR increased by 2.56 times from 53.87×10⁴ km2 to 137.80×10⁴ km2, and the fractional cropland area increased from 12.73% to 27.30% with an average annual growth rate of 0.12 percentiles. The per capita cropland areas decreased to 0.0191 km2 in 1856. Among the second phase, arable land increased by 51.04% and 36.79% in the periods of 1763-1796 and 1796-1856, respectively. After the Russian Reform in 1861, from 1856 to 1887, cropland area and fractional cropland area had increased by 23.82% and 4.49 percentiles, respectively. The rate of increase of the cropland area was less than that of 1763-1796.
The third phase is from 1887 to 1914, when the total cropland area increased from 137.80×10⁴ km2 to 147.40×10⁴ km2, and the fractional cropland area increased from 27.30% to 29.20% with an average annual growth rate of 0.07 percentiles. The per capita cropland areas decreased to 0.0113 km2 in 1914.
3.2 Changes in the spatial distribution of cropland cover for 1719-1914
During 1719-1914, the high fractional cropland areas were distributed in the central ETR, surrounding area of the Volga River, Ukraine region, and the new Russia region (Figure 3), which are the traditional agricultural areas in Russia and Eastern Europe (Mao and Qiu, 1984). The fractional cropland area for most provinces in these regions was greater than 50% in 1914. However, the fractional cropland area in 1914 was less than 5% for the provinces of Arkhangelsk and Olonets in the northern region of ETR because of unfavourable climatic conditions (Figure 3).
Figure 3.
Distribution of the provincial fractional cropland area in ETR during 1719-1914
In 1719, 79.23% of the cropland area within ETR was concentrated in 20 provinces where located in the central and southwest of ETR and the middle reaches of the Volga River. There were 17 provinces within ETR in which the fractional cropland area was greater than 20% (Figure 3). Disregarding the provinces without data, the fractional cropland area in Chernigov Province was the highest, at 51.53%, while that in Arkhangelsk Province was the lowest, at 0.41%. Poltava Province and Chernigov Province had the most cropland area, both exceeding 2.5×10⁴ km2. From 1719 to 1795, the fractional cropland area for the black soil region, surrounding area of the Volga River, and Ukraine region increased markedly by more than 10 percentiles (Figure 4).
Figure 4.
Changes of the provincial fractional cropland area in ETR during 1719-1914
In 1795, 77.72% of the cropland area within ETR was concentrated in 26 provinces. There were 25 provinces within ETR where the fractional cropland area was greater than 30% (Figure 3). These provinces were mainly distributed in the same regions as in 1719, the lower reaches of the Volga River, the black soil region in the central ETR, and Ukraine region. Disregarding the provinces without data, the fractional cropland area was the highest in Tula Province, at 64.60%, while the value in Arkhangelsk Province was the lowest, at 0.48%. The provinces of Poltava, Chernigov, Kiev, Wolyn, and Kursk had the largest cropland area, with more than 2.5×10⁴ km2. During 1795-1856, the fractional cropland area for the black soil region, surrounding area of the Volga River, new Russia region and the vicinity of Ural increased markedly, by more than 10 percentiles (Figure 4).
In 1856, 74.24% of the cropland area of ETR was concentrated in 29 provinces. There were 25 provinces within ETR where the fractional cropland area was greater than 40% (Figure 3). These provinces were mainly distributed in the same regions as in 1795, new Russia region, and the vicinity of Ural. Disregarding the provinces without data, the fractional cropland area in Kursk Province was the highest, at 69.13%, while that in Arkhangelsk Province was the lowest, at 0.58%. The provinces of Vyatka, Perm, Samara, Yekaterin Noslav and Kherson had the largest cropland area, with more than 3.5×10⁴ km2. During 1856-1914, the fractional cropland area increased markedly by more than 10 percentiles in the central and western ETR, surrounding area of the Volga River, Ukraine region, new Russia region, and the vicinity of Ural (Figure 4).
In 1914, there were 25 provinces within ETR where the fractional cropland area was greater than 50% (Figure 3). These provinces were mainly distributed in the same regions as in 1856. There were 20 provinces, each of which had more than 3.0×10⁴ km2 of cropland, accounted for 54.60% of the cropland area of ETR. They were located in the black soil region in the central ETR, surrounding area of the Volga River, Ukraine region, new Russia region, the vicinity of Ural, and north Caucasus region. The fractional cropland area in Yekaterin Noslav Province was the highest, at 76.68%, while that in Arkhangelsk Province was the lowest, at 0.76%. Within ETR, the cropland area was the highest in Perm Province, with 5.65×10⁴ km2, while Black Sea Province had the lowest cropland area, with 0.16×10⁴ km2.
3.3 The explanation for the changes in cropland
In the following sections, we explain the reasons for the changes in cropland within ETR during 1696-1914. The reasons include war and the expansion of territory, the increase and migration of population, the policies related to agricultural development and foreign trade, and climate change. The combination of these factors and the constant interaction between them best explain how Russia's cropland changed between the late 17th century and the early 20th century.
3.3.1 War and the expansion of territory
From 1696 to 1914, the Russian Empire expanded its territory to the south and west of ETR through war and gained considerable land. Among these new territories, there was much land covered by black earth and grey forest earth. The fertility of black soils and grey forest soils is superior to that of the podzolic soils of the central ETR and more suitable for agricultural development (Kalesnik, 1978; James and French, 1983; Richard, 1987).
Black soil is widely distributed in the Ukraine region in the south of the Russian Empire, but this region often suffered from the onslaught of Tatars raiding. In the first half of the 17th century, approximately 200,000 Russians were captured as slaves by the Tatar Khanate of Crimean (Kalesnik, 1978; Inalcik, 1979). Especially severe were the raids of 1680 and 1691 when large numbers of people were taken or died and much livestock was lost (James and French, 1983). Therefore, the annexation of the Crimean Peninsula and the steppe along the Black Sea was very important for the consolidation of the security along the southern border of the Russian Empire and the development of its economy (Smith, 1959; Smith, 1977). The Russian Empire waged a protracted war with the Crimean Khanate and Turkey, and it seized the Crimean Peninsula, the coast of the Black Sea and Bessarabia in the 1780s, 1790s and 1812, respectively. After 1791, the territory of the Russian Empire was close to the north Caucasus region; a Caucasian war broke out between the Russian Cossack Army and the Caucasian people, which ended in 1864 (Kalesnik, 1978; Mironov, 2012). However, south of the Ukraine region, Crimean Peninsula and Kuban region remained pastoral areas for a long time after they were incorporated into the Russian Empire (Kalesnik, 1978).
In 1795, the Kingdom of Poland and the Grand Duchy of Lithuania were divided up by the Russian Empire, Kingdom of Prussia and Archduchy of Austria. The territory of the Russian Empire extended westward to the regions of Estonia, Latvia, Lithuania, Belarus, and the west of Ukraine (Kalesnik, 1978). The north of Lithuania region was annexed by the Russian Empire after 1815 (Mironov, 2012).
3.3.2 The increase and migration of population
During 1696-1914, the population of the Russian Empire increased throughout this period, although death rates were very high, on average birth rates were even higher (David, 1999). Meanwhile, the processes of various forms of population migration and land reclamation by migrants are one of the most important characteristics of Russian historical geography. Internal migration is the main feature of the Russian Empire, unlike Western Europe (Kalesnik, 1978).
In the period of 1696-1914, the population of ETR increased from 13.0 million to ~133.32 million, and the average rate of growth per annum was 4.25% over this period (David, 1999; Mironov, 2012). From 1696 to 1763, the population of ETR gradually increased to 23.5 million. Within this period, the population increased by 24.62% during 1696-1725, and the arable land area increased by 30.87%. Therefore, the per capita cropland area of ETR increased slightly, to 0.0258 km2 (Figure 2). From 1763 to 1856, the population of ETR increased to 58.4 million. Within this period, the population increased by 62.55% during 1763-1796. In the last 30 years of the 18th century, the decrease in temperature led to a decrease in grain yield per unit area (Mironov, 2012). Meanwhile, with the rapid increase of population and the implementation of a policy that encouraged grain export, the demand for grain in domestic and foreign markets greatly increased. Under the impact of such factors, the arable land area increased rapidly, by 51.04%, in the period of 1763-1796 (Kalesnik, 1978; David, 1999; Mironov, 2012). After the Russian Reform in 1861, the population of ETR increased by 128.29% during 1856-1914, and the average rate of growth per annum over this period was 2.21%. Within this period, the arable land area increased by 23.82% in the period of 1856-1887.
Before the early 18th century, approximately two-thirds of the population was concentrated in the northern ETR and in the non-black soil region in the central ETR (David, 1999; Mironov, 2012). In the following two centuries, the settlement patterns of peasant settlers changed considerably as a result of mass migration to the east and south (David, 1999). After the annexation of the Crimean Khanate by the Russian Empire in the 1780s, a life-threatening situation caused by the attack of nomadic people in the steppe of southern region of ETR was eliminated. From the 1780s to the middle of the 19th century, new Russia region and north Caucasus region, which were newly merged into the Russian Empire, provided new directions for migration (Kalesnik, 1978). Moreover, mass migration to the lower reaches of the Volga River and the vicinity of Ural began after the last 20 years of the 18th century (Table 2) (Mironov, 2012). The reclamation of the above-mentioned regions by migrants increased the cropland area of ETR. After the 1780s, the population center of the Russian Empire gradually moved to the south of ETR. Then, the population in the south of ETR surpassed that in the north of ETR in the early 19th century (David, 1999; Mironov, 2012). The proportion of the Russian population living in the south of ETR increased steadily to ~66% by the 1914 (Mironov, 2012). Moreover, few Russian migrants moved to the west of ETR since this region already had its own indigenous peasant populations and had little land available for settlement (David, 1999).
Region
Time
the black soil region in the central ETR
surrounding area of the Volga River and the vicinity of Ural
new Russia region
north Caucasus region
1678-1782
63
27
1782-1858
96.8
151
1870-1915
43.8
137.8
198.3
Table 2.
The number of migrants to different regions in ETR from 1678 to 1915 (104 people)
3.3.3 The policies related to agricultural development and foreign trade
The main form of agriculture practiced by Russian peasant was grain cultivation. In the 18th and 19th centuries, over 90% of the cropland in the Russian Empire was used for grain, and the major food grain was rye (David, 1999; Richard, 1987).
From 1696 to 1796, deforestation for reclamation of arable land, which promoted the increase of cropland area in this period, was a common agricultural development policy within ETR (Kalesnik, 1978; Mironov, 2012). Saint Petersburg was established by Peter the Great in 1703 (David, 1999). In 1713, the capital of the Russian Empire moved from Moscow to Saint Petersburg, and the latter soon became the principal port of Russia. At the same time, many goods were banned from export by the government in Arkhangelsk within the north of ETR (Kalesnik, 1978). In the early 18th century, Russia entered the European markets as a food supplier. Grain exports were a spur to very intensive reclamation of cropland, and the increase of cropland area of ETR during 1696-1725 is also related to the export practice (Kalesnik, 1978; Mironov, 2012). From 1703 to 1725, 90%-95% of Russia's foreign trade goods were exported from Saint Petersburg (Kalesnik, 1978). In the middle of the 18th century, with the growth rate at which grain was being traded, Russia needed a seaport on the Black Sea so that agricultural products could be exported abroad. However, the sea route to the Black Sea was controlled by the Crimean Khanate and Turkey; this was one of the reasons for the war between the Russian Empire and these two countries in the second half of the 18th century (Kalesnik, 1978; Mironov, 2012). In the 1760s, the government scrapped control over the grain exports. A large amount of forests and uncultivated land was reclaimed for cropland within ETR during the 1760s-1800 (Mironov, 2012). Foreign trade commodities accounted for 41% of the total volume of commodities within the Russian Empire in 1800.
After the 1850s, the south of ETR became the major production area of grain exports in the Russian Empire (Kalesnik, 1978). In the 1860s, the grain yield in the Ukraine region, new Russia region, north Caucasus region and the vicinity of Ural increased by 200%, while the grain yield in the black soil region in the central ETR and the middle reaches of the Volga River increased by 50%. The grain yield in the non-black soil region in the central part of ETR increased only by 33% in the same period (Kalesnik, 1978). After the reform in 1861, the government annulled the serf system and promoted a series of policies to develop agriculture. At the end of the 19th century, the use of improved agricultural implements and machinery increased production from cropland, and agricultural advisory services were also established (James and French, 1983; Mironov, 2012).
During 1696-1914, reclamation occurred in surrounding area of the Volga River, the black soil region in the central ETR, the Ukraine region, new Russia region, the vicinity of Ural, and north Caucasus region. In these regions, the government issued policies to promote migration and land reclamation, and the area of cropland subsequently increased. Moreover, the major granary of the Russian Empire moved from the steppe between the Oka River and Volga River to the black soil region and surrounding area of the Volga River, then to the south and east, first to the Ukraine region and, from the early 19th century, to the new Russia region, the vicinity of Ural, and north Caucasus region (Kalesnik, 1978; Mironov, 2012).
3.3.4 The impacts of climate change
In the second half of the 18th century, the severe cold and strong winds that were unfavorable to crops were frequent in most parts of ETR, which resulted in a decrease of grain yield (Mironov, 2012). From 1760 to 1810, the yield per unit area of rye decreased by 31.91%, while the annual mean temperature in Saint Petersburg, which is the city with the earliest and longest temperature record in ETR, decreased by 0.65 ℃ (Kalesnik, 1978; Mironov, 2012). To compensate for the decline of grain yield and the growing demand for food in domestic and foreign markets, the cropland area of ETR increased rapidly during this period. During 1810-1879, the yield per unit area of rye increased by 12.50%, while the annual mean temperature in Saint Petersburg increased by 0.79 ℃ (Kalesnik, 1978; Mironov, 2012). The grain yield of ETR showed an increasing trend in the same period (Mironov, 2012).
4 Discussion
4.1 Credibility of the reconstructed results
This study reconstructed the cropland area of ETR for 8 time sections over the late 17th to the early 20th centuries using data on cropland area, population, grain consumption and grain yield per unit area from historical documents.
To evaluate the credibility of the reconstructed results in this study, we compared them with the available values in other published literatures. The differences in fractional cropland area, food and feed consumption, and cropland area were less than 10% (Table 3). This means that the results in this study are credible.
25% (Tomson et al., 2015) - 31% (Poska et al., 2014)
-
Lithuania
49.54%
43.62% (Li, 1981)
-5.92 percentiles
Latvia
34.46%
32.31% (Li, 1981)
-2.15 percentiles
Per capita food and feed consumption
1856
ETR
345.15 kg
349.88kg (Mironov, 2012)
1.37%
Cropland area
1914
Kherson
48889.10 km2
46684.70 km2 (Kondratieff, 2017)
-4.51%
Saratov
29348.85 km2
28229.00 km2(Mironov, 2012)
-3.82%
European Russia
97.62 (104 km2)
69.80-104.70 (104 km2) * (Li, 1981)
-
Ukraine
32.23 (104 km2)
27.95-41.93 (104 km2) * (Li, 1981)
-
Moldova
2.90 (104 km2)
2.07-3.11 (104 km2) * (Li, 1981)
-
Belarus
5.55 (104 km2)
4.54-6.81(104 km2) * (Li, 1981)
-
ETR
1473955.78 km2
1449663.45 km2 (Kondratieff, 2017)
-1.65%
Table 3.
Differences of fractional cropland area, per capita food and feed consumption, and cropland area in ETR from 1696 to 1914 between this study and other studies
4.2 Comparison with the cropland area derived from the HYDE 3.2 dataset
We compared our findings on the total cropland area of ETR with that derived from the HYDE 3.2 dataset for years close to the 8 time sections. According to the HYDE dataset, the total cropland area of ETR increased from 15.47×10⁴ km2 to 105.85×10⁴ km2 during 1700-1920 (Figure 5). In this study, the total cropland area of ETR increased from 31.98×10⁴ km2 to 147.40×10⁴ km2 between 1696 and 1914. The relative differences between this study and the HYDE 3.2 dataset enlarged from 28.19% in 1914 to 51.63% in 1696. The main reason for these differences might be the underestimation of per capita cropland area in the HYDE 3.2 dataset (Figure 5). The per capita cropland areas of ETR in the HYDE 3.2 dataset remained at ~0.01 km2 from 1700 to 1920 (Klein Goldewijk et al., 2017). In contrast, they decreased from 0.0246 km2 to 0.0113 km2 during 1696-1914 in this study (Figure 5).
Figure 5.
Comparison of cropland area and per capita cropland area in ETR between this study and HYDE 3.2 from 1696 to 1914
As discussed by Kaplan (Kaplan, 2015), these uncertainties may influence the calculation result of cropland cover reconstruction within ETR during the study period.
4.3 Uncertainties
Studies concerning LUCC over the past 300 years in ETR are rare. Therefore, we reconstructed the cropland area of ETR for 1696-1914. The uncertainties of this work have also been considered.
First, according to Equation (3), the per capita food and feed consumption was calculated by the urban food and feed consumption, rural food and feed consumption, and the total popu- lation. The result calculated by Equation (3) is the per capita food and feed consumption on regional scale; however, this value may differ on provincial scales. Thus, a reconstruction of the per capita food and feed consumption of different provinces within ETR that is based on more historical documents is needed in future studies. Second, there are uncertainties associated with the calculation of the total grain consumption during this period. Because the amount of grain transported into each province was difficult to obtain (Zhang and Fan, 2012), we ignored the impact of grain transportation on grain consumption for each province. Moreover, several uncertainties still exist in this study. For instance, the differences of arable land area in provinces of Kherson and Saratov, are ~5% between this study and other literatures (Table 3).
5 Conclusions
The cropland areas of ETR on regional and provincial scales for 1696-1914 were estimated based on the historical records. The major conclusions are as follows.
From 1696 to 1914, the total cropland area of ETR increased from 31.98×10⁴ km2 to 147.40×10⁴ km2, the fractional cropland area increased from 7.89% to 29.20%, and the per capita cropland area decreased from 0.0246 km2 to 0.0113 km2. The total cropland area in the 8 time sections showed three phases: 1696-1763, 1763-1887 and 1887-1914.
With the expansion of territory, increase and migration of population, development of agricultural production and foreign trade, and the impacts of climate change, the cropland in ETR expanded from central to eastern, southern and western regions of ETR during 1719 to 1914. In 1914, the cropland area and fractional cropland area in each province covered from 0.16×10⁴ km2 to 5.65×10⁴ km2 and 0.76% to 76.68%, respectively; the high cropland covers of ETR were mainly distributed in the black soil region, surrounding area of the Volga River, Ukraine region, the new Russia region, the vicinity of Ural and north Caucasus region.
The relative differences in cropland area of ETR between this study and HYDE 3.2 dataset enlarged from 28.19% in 1914 to 51.63% in 1696. The per capita cropland areas of ETR decreased from 0.0246 km2 to 0.0113 km2 during 1696-1914 in this study; however, they remained at ~0.01 km2 from 1700 to 1920 in HYDE 3.2 dataset.
[2] et alImpacts of land use and land cover change on regional climate: A case study in the agro-pastoral transitional zone of China. Geophysical Research Letters, 10, 124025(2016).
[20] Land use and its influence on the nature of the Central Forest Reserve (the end of 16th-the beginning of the 20th century). In: Forest Successions in Protected Areas of Russia and Problems of Biodiversity Conservations. St. Petersburg: Russian Botanical Society(1999).
[23] Per-capita estimations of long-term historical land use and the consequences for global change research. Journal of Land Use Science, 12, 313-337(2017).
[24] . The Grain Market of Russia in the Period of War and Revolution.(2017).
[31] . Agricultural Geography of the Union of Soviet Socialist Republics.(1984).
[32] Methodological aspects of the analysis of the land use structure in the Kasimov District at the end of the XVIII century. Geodesy and Cartography, 42, 59-64(2016).
[33] . Life History of the Tsarist Russia Age.(2012).
[34] Evolution of natural and social science interactions in global change research programs. Proceedings of the National Academy of Sciences of the United States of America, 110, 3665-3672(2013).
[35] et alThe last hundred years of land use history in the southern part of Valdai Hills (European Russia): Reconstruction by pollen and historical data. Studia Quaternaria, 34, 73-81(2017).
[36] et alA reconstruction of global agricultural areas and land cover for the last millennium. Global Biogeochemical Cycles, 22, GB3018(2008).
[37] et alBiogeophysical versus biogeochemical climate response to historical anthropogenic land cover change. Geophysical Research Letters, 37, L08702(2010).
[40] . The Economy and Material Culture of Russia, 1600-1725.(1987).
[41] et alLand use and land cover change impacts on the regional climate of non-Amazonian South America: A review. Global and Planetary Change, 128, 103-119(2015).
[42] Reconstruction of the land uses that led to the termination of an arid coastal dune system: The case of the Guanarteme dune system (Canary Islands, Spain), 1834-2012. Land Use Policy, 55, 73-85(2016).
[43] Assessing the implications of human land-use change for the transient climate response to cumulative carbon emissions. Environmental Research Letters, 11, 035001(2016).
[44] et alThe biogeophysical climatic impacts of anthropogenic land use change during the Holocene. Climate of the Past, 12, 923-941(2016).
[45] The Origins of Farming in Russia. Paris: MOUTON &CO.(1959).
[46] . Peasant Farming in Muscovy..
[47] et alAgriculture, Forestry and Other Land Use (AFOLU). In: Climate Change 2014 Mitigation of Climate Change Contribution of Working Group III to the Fifth Assessment Report of the Intergovernmental Panel on Climate Change. Cambridge: Cambridge University Press.(2014).
[53] Changes in forest land percentage of European Russia from the end of the 17th century to 1914. Moscow: Academy of Sciences of the Union of Soviet Socialist Republics(1957).
[59] The river transportation, commodity circulation and economic development of European Russia at the first half of the 19th century. Russian, East European and Central Asian Studies, 2, 54-66(2012).
[60] Reconstructed cropland in the mid-eleventh century in the traditional agricultural area of China: Implications of comparisons among datasets. Regional Environmental Change, 13, 969-977(2013).
Zhilong ZHAO, Xiuqi FANG, Yu YE, Chengpeng ZHANG, Diyang ZHANG. Reconstruction of cropland area in the European part of Tsarist Russia from 1696 to 1914 based on historical documents[J]. Journal of Geographical Sciences, 2020, 30(8): 1307