


Dian-kai ZHANG, Yan-hong LI, Chang-yu ZI, Yuan-qin ZHANG, Rong YANG, Guo-cai TIAN, Wen-bo ZHAO. Molecular Structure and Molecular Simulation of Eshan Lignite[J]. Spectroscopy and Spectral Analysis, 2022, 42(4): 1293
- Spectroscopy and Spectral Analysis
- Vol. 42, Issue 4, 1293 (2022)
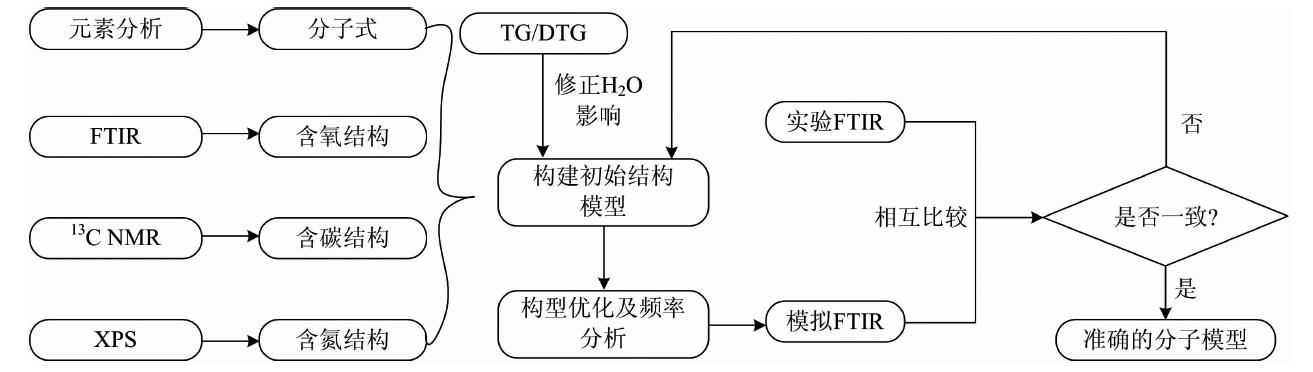
Fig. 1. Flow chart of molecular structure model construction
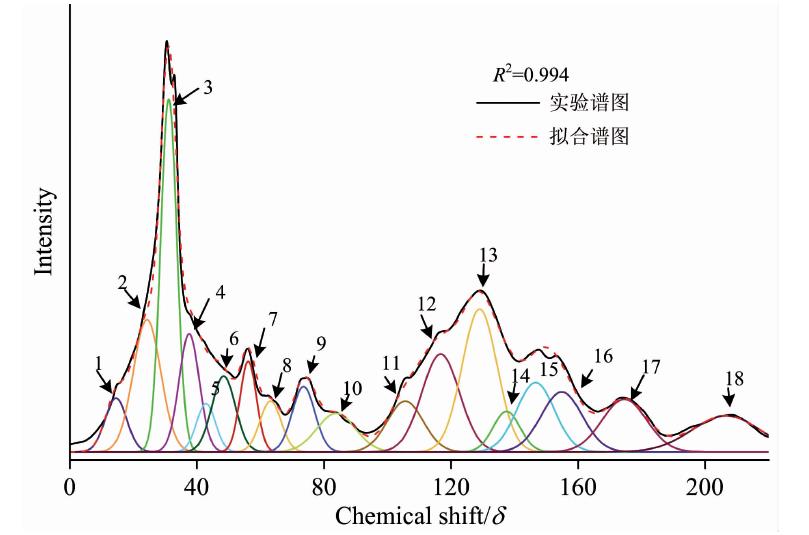
Fig. 2. 13C NMR peak fitting curve of EL
Fig. 3. FTIR peak fitting spectra of the oxygen-containing functional group (a) and hydroxyl functional group (b) of EL
Fig. 4. XPS [N(1s )] peak fitting of EL
Fig. 5. TG/DTG curve of EL
Fig. 6. Molecular structure model of EL
gray, silver, red and blue represents carbon, hydrogen, oxygen and nitrogen, respectively
gray, silver, red and blue represents carbon, hydrogen, oxygen and nitrogen, respectively
Fig. 7. Comparison of simulated FTIR and experimental FTIR of EL
| |||||||||||||||||||||||||||||||||||
Table 1. Proximate analysis and ultimate analysis results of EL
|
Table 2. Chemical shift and content of carbon-containing functional groups in 13C NMR spectrum
|
Table 3. Peak fitting data of oxygen-containing functional groups of EL
|
Table 4. XPS analysis results of EL


Set citation alerts for the article
Please enter your email address

© Copyright 2018-2021 | Chinese Laser Press. All Rights Reserved 沪ICP备15018463号-20