
Zijun Zhou, Fulin Jiang, Fazhan Yang, Yuling Wang, Yong Yang, Pengfang Song, Zhaolin Zhong. Eutectic Behavior and Wear and Corrosion Resistance Mechanisms of FeCoNiCrNb0.5Mo0.25 High-Entropy Alloy Laser Cladding Layer Microstructure[J]. Chinese Journal of Lasers, 2023, 50(4): 0402011
- Chinese Journal of Lasers
- Vol. 50, Issue 4, 0402011 (2023)
![Failure mode of ship stern shaft[20-21]](/richHtml/zgjg/2023/50/4/0402011/img_01.jpg)
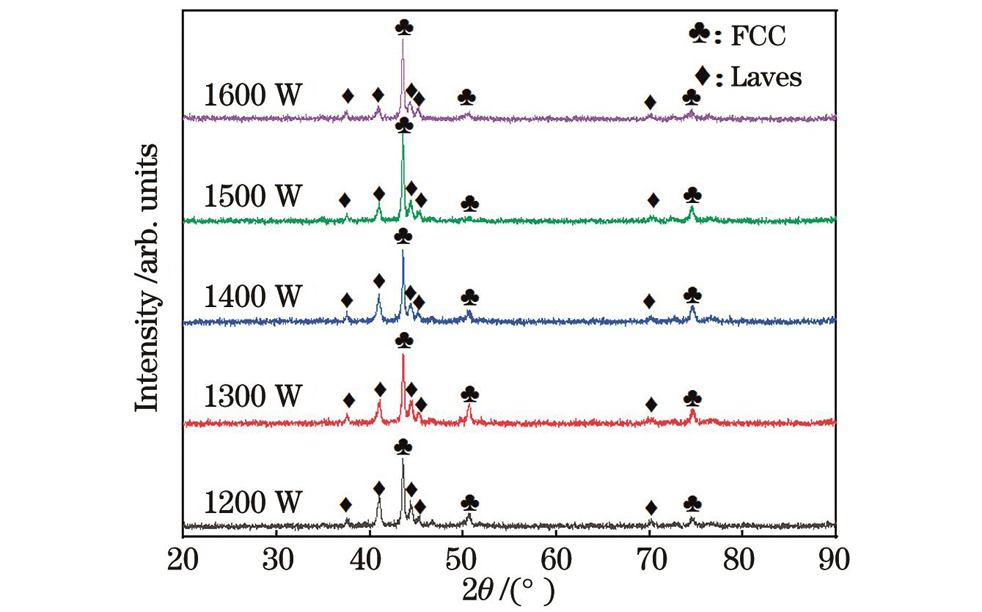
Fig. 2. XRD results of FeCoNiCrNb0.5Mo0.25 high-entropy alloy cladding layer prepared at different laser powers
Fig. 3. SEM images of FeCoNiCrNb0.5Mo0.25 high-entropy alloy cladding layer prepared at different laser powers
Fig. 4. Microstructures of FeCoNiCrNb0.5Mo0.25 high-entropy alloy cladding layer prepared at different laser powers
Fig. 5. Microhardness test results. (a) Microhardness test position; (b) microhardness curve; (c) average microhardness of cladding layer
Fig. 6. Element distributions of top of FeCoNiCrNb0.5Mo0.25 high-entropy alloy cladding layer prepared at different laser powers. (a) EDS line scanning direction; (b) 1200 W; (c) 1300 W; (d) 1400 W; (e) 1500 W; (f) 1600 W
Fig. 7. Friction coefficient of substrate sample and FeCoNiCrNb0.5Mo0.25 high-entropy alloy cladding layer samples prepared at different laser powers. (a) Friction coefficient curve; (b) average friction coefficient
Fig. 8. Low magnification and high magnification images of wear morphology of substrate sample and FeCoNiCrNb0.5Mo0.25 high-entropy alloy cladding layer samples prepared at different laser powers. (a1)(a2) 1200 W; (b1)(b2) 1300 W; (c1)(c2) 1400 W; (d1)(d2) 1500 W; (e1)(e2) 1600 W; (f1)(f2) substrate
Fig. 9. Element distribution of on wear surface
Fig. 10. Three dimensional image and contour curve of wear surface of substrate sample and FeCoNiCrNb0.5Mo0.25 high-entropy alloy cladding layer samples prepared at different laser powers. (a) 1200 W; (b) 1300 W; (c) 1400 W; (d) 1500 W; (e) 1600 W; (f) substrate
Fig. 11. Wear rate of high-entropy alloy cladding layer and substrate
Fig. 12. Relationship between wear rate of high-entropy alloy cladding layer and H/E*
Fig. 13. Polarization curves of FeCoNiCrNb0.5Mo0.25 high-entropy alloy cladding layer and substrate samples in 3.5% NaCl solution
Fig. 14. Surface corrosion morphologies of substrate sample and FeCoNiCrNb0.5Mo0.25 high-entropy alloy cladding layer samples prepared at different laser powers. (a) 1200 W; (b) 1300 W; (c) 1400 W; (d) 1500 W; (e) 1600 W; (f) substrate
Fig. 15. Local enlarged feature of corrosion surface of high-entropy alloy cladding layer
Fig. 16. Relationship between FCC phase content and self corrosion current density
|
Table 1. Chemical composition of 42CrMo steel[34]
|
Table 2. Element binary mixing enthalpy[35]
| ||||||||||||||||||||||||||||||||||||||||||||||||||||||||||||||||||||||||||||||||||||||||||||||||||||||||||||||||||||||||||||
Table 3. Element content in different regions of FeCoNiCrNb0.5Mo0.25 high-entropy alloy cladding layer prepared at different laser powers
| |||||||||||||||||||||||||||||||||||||||||||||||||||||||
Table 4. Each element content in FeCoNiCrNb0.5Mo0.25 cladding layer prepared at different laser powers
| |||||||||||||||||||||||||||||||||||||||||||||||||||||||||||||||||||||||||||||||||||||||||
Table 5. Element content of phases of A and B in FeCoNiCrNb0.5Mo0.25 high-entropy alloy cladding layer prepared at different laser powers
|
Table 6. Microhardness H and effective elastic modulus E* of high-entropy alloy cladding layer obtained by nanoindentation test
|
Table 7. Electrochemical parameters of FeCoNiCrNb0.5Mo0.25high-entropy alloy cladding layer and substrate samples in 3.5% NaCl solution
| |||||||||||||||||||||||||||||||||||||||||||||||||||||||||||||||||||||||||||||||||||||||||||||||||||||||||||||||||||||||||||||||||||||
Table 8. Element content in different corrosion areas


Set citation alerts for the article
Please enter your email address

© Copyright 2018-2021 | Chinese Laser Press. All Rights Reserved 沪ICP备15018463号-20