• Acta Optica Sinica
  • Vol. 41, Issue 11, 1101002 (2021)
Tao Wang1、2, Chuanjie Zhou3, Weining Yi1, jin Hong1, Nan Zhou1、2, wei Fang1, dongying Zhang1, lili Du1, Kaitao Li4, and Wenyu Cui1、*
Author Affiliations
  • 1Key Laboratory of Optical Calibration and Characterization, Anhui Institute of Optics and Fine Mechanics, Hefei Institutes of Physical Science, Chinese Academy of Sciences, Hefei, Anhui 230031, China
  • 2University of Science and Technology of China, Hefei, Anhui 230026, China
  • 3Beijing Institute of Remote Sensing Information, Beijing 100085, China
  • 4State Environmental Protection Key Laboratory of Satellite Remote Sensing, Institute of Remote Sensing and Digital Earth, Chinese Academy of Sciences, Beijing 100101, China
  • show less
    DOI: 10.3788/AOS202141.1101002 Cite this Article Set citation alerts
    Tao Wang, Chuanjie Zhou, Weining Yi, jin Hong, Nan Zhou, wei Fang, dongying Zhang, lili Du, Kaitao Li, Wenyu Cui. Improving Quality of Sub-Meter Satellite Image Based on Atmospheric Correction[J]. Acta Optica Sinica, 2021, 41(11): 1101002 Copy Citation Text show less
    Flowchart of adaptive-AC
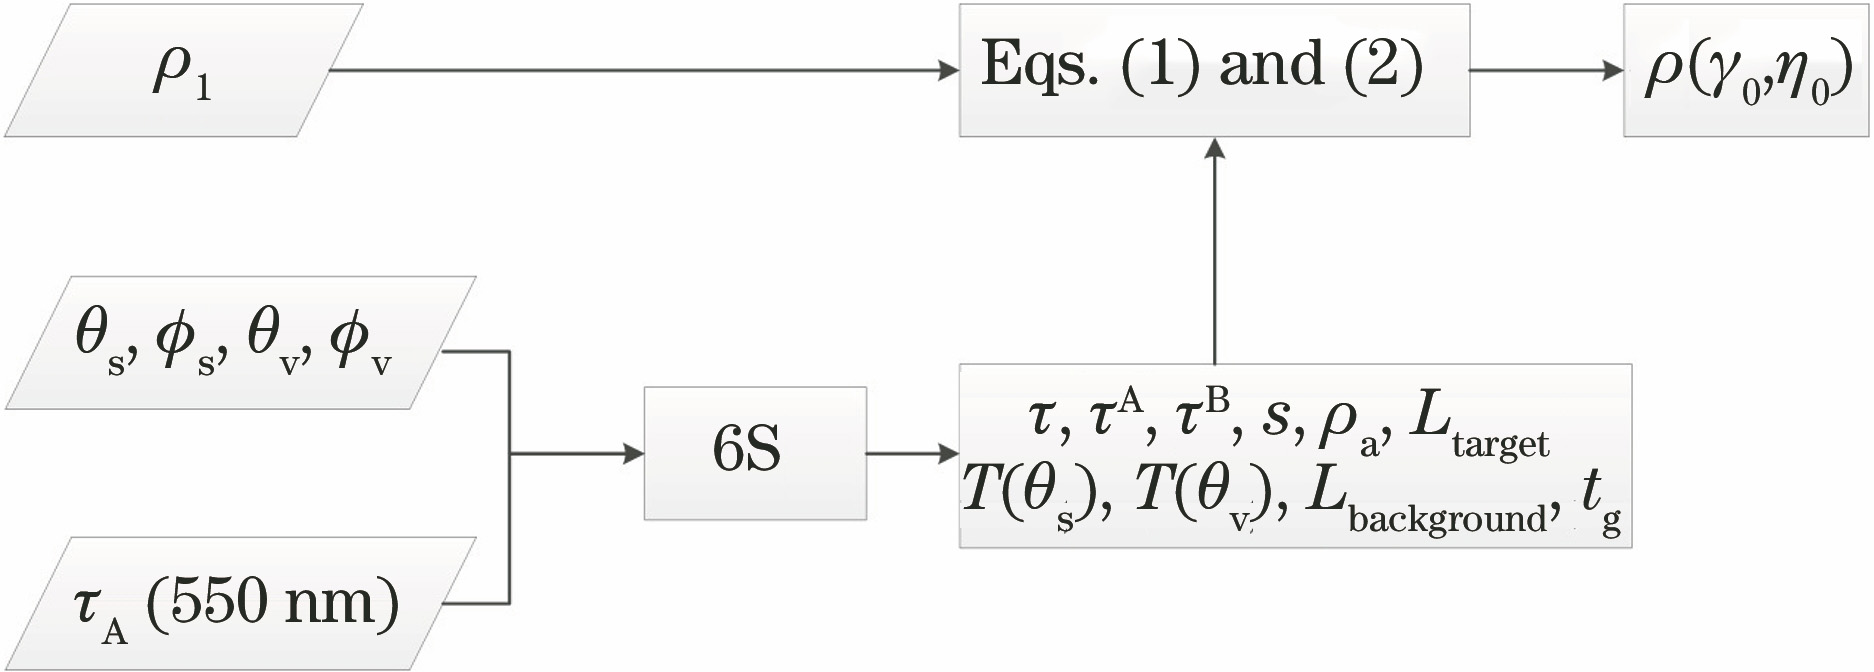
    Fig. 1. Flowchart of adaptive-AC
    Relative spectral radiance response curves for WV-3 VNIR band
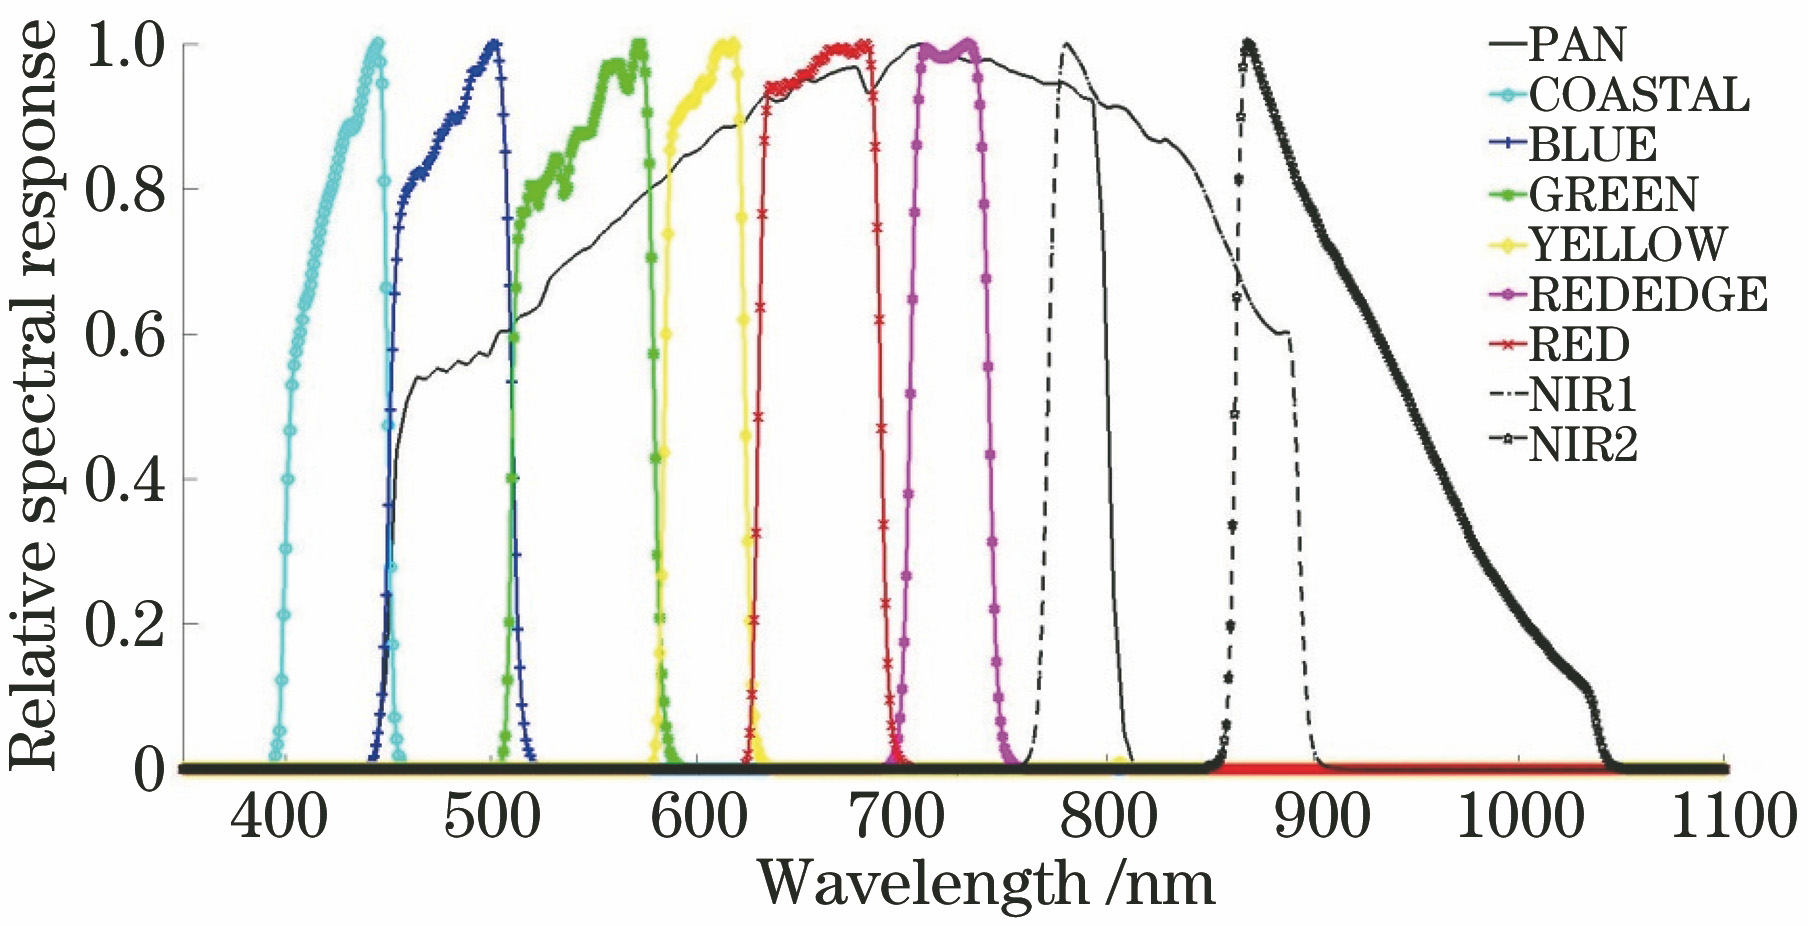
    Fig. 2. Relative spectral radiance response curves for WV-3 VNIR band
    WV-3 panchromatic band satellite image. (a) Apparent reflectance image; (b) satellite image after atmospheric correction (denoted as “adaptive-AC real surface reflectance image”); (c) result of 2% linear stretching of apparent reflectance image (denoted as “2% linear stretching image”); (d) result of filtering for apparent reflectance image using Prewitt operator (denoted as “Prewitt operator filtering image”)
    Fig. 3. WV-3 panchromatic band satellite image. (a) Apparent reflectance image; (b) satellite image after atmospheric correction (denoted as “adaptive-AC real surface reflectance image”); (c) result of 2% linear stretching of apparent reflectance image (denoted as “2% linear stretching image”); (d) result of filtering for apparent reflectance image using Prewitt operator (denoted as “Prewitt operator filtering image”)
    Gray distributions of satellite images. (a) Gray distribution of apparent reflectance image; (b) gray distribution of adaptive-AC real surface reflectance image; (c) gray distribution of 2% linear stretching image; (d) gray distribution of Prewitt operator filtering image
    Fig. 4. Gray distributions of satellite images. (a) Gray distribution of apparent reflectance image; (b) gray distribution of adaptive-AC real surface reflectance image; (c) gray distribution of 2% linear stretching image; (d) gray distribution of Prewitt operator filtering image
    Spectrogram distributions of two-dimensional discrete Fourier transform [small circle area corresponds to low frequency information of satellite image (the brighter the color in this area, the more the low frequency information in satellite image), the area between small and large circles corresponds to high frequency information of satellite image (the brighter the color in this area, the more the high frequency information in satellite image)]. (a) Fourier spectrogram distribution of apparent reflectance image; (b) Fourier spectrogram distribution of adaptive-AC real surface reflectance image; (c) Fourier spectrogram distribution of 2% linear stretching image; (d) Fourier spectrogram distribution of Prewitt operator filtering image
    Fig. 5. Spectrogram distributions of two-dimensional discrete Fourier transform [small circle area corresponds to low frequency information of satellite image (the brighter the color in this area, the more the low frequency information in satellite image), the area between small and large circles corresponds to high frequency information of satellite image (the brighter the color in this area, the more the high frequency information in satellite image)]. (a) Fourier spectrogram distribution of apparent reflectance image; (b) Fourier spectrogram distribution of adaptive-AC real surface reflectance image; (c) Fourier spectrogram distribution of 2% linear stretching image; (d) Fourier spectrogram distribution of Prewitt operator filtering image
    ParameterCondition
    Imaging time2018-04-01T03:45: 22
    θs /(°)36.1
    ϕs /(°)165.8
    θv /(°)25.1
    ϕv /(°)297.2
    Aerosol modelUrban
    τA(550 nm)1.02
    Atmospheric modelSubarctic summer
    Band range /μm0.45--0.8
    Table 1. Atmospheric parameters and geometric conditions for observation
    DatasourceTime(UTC)SiteAOD
    LongitudeLatitude
    SONETBeijing site2018-04-01T03:49116.4008°E40.0003°N1.0205
    MODIS2018-04-01T03:50116.2628°E40.2367°N1.0829
    WV-3image2018-04-01T03:45116.2939°E (center)39.9838°N (center)-
    Table 2. Spatial-temporal information of WV-3 satellite image, AOD of Terra MODIS product, and AOD measured at SONET Beijing site
    Evaluation parameterCCLARCCONTEENTR
    Apparent reflectance image2630.79250.67053.7323
    Adaptive-AC real surface reflectance image14541.59360.96966.1292
    2% linear stretching image1010700610.0522
    Prewitt operator filtering image764013.4112
    Table 3. Values of CCLAR, CCONT, and EENTR for each image in Fig. 3
    Tao Wang, Chuanjie Zhou, Weining Yi, jin Hong, Nan Zhou, wei Fang, dongying Zhang, lili Du, Kaitao Li, Wenyu Cui. Improving Quality of Sub-Meter Satellite Image Based on Atmospheric Correction[J]. Acta Optica Sinica, 2021, 41(11): 1101002
    Download Citation