Abstract
An optical whispering gallery mode (WGM) resonator supports degenerate counter-propagating modes and the degeneracy is lifted as mode splitting due to Rayleigh scattering. However, quantitative analysis becomes difficult if the resonance experiences weak scattering. Here we develop a spectroscopical method to identify an arbitrary small scatterer using the Fano interference-induced spectral response modification. Scattering information can be revealed by fitting the responses as a function of the field’s phase and intensity. In addition, we show that this modified response helps achieve an ultra-low detection limit for the mode-splitting-based nanoparticle detection method. This approach may be promising in the characterization of high--factor devices, novel sensing methods, and quantum coupling system investigation.1. INTRODUCTION
The whispering gallery mode (WGM) optical resonator is a kind of a promising resonance photonic device because of its ultra-long photon lifetime, i.e., -factor and highly localized mode intensity. The resultant enhanced light–matter interaction renders this resonator intensively explored in the fields of nonlinear optics and integrated optics and sensing, including biosensing, cavity optomechanics, and Kerr frequency combs [1–5]. The WGM resonator supports a twofold degeneracy between clockwise (CW) and counterclockwise (CCW) propagating modes, whose loss rate and resonance frequency are theoretically identical. If the nanoscale refractive index inhomogeneity spatially overlaps with the mode field, the resultant Rayleigh scattering would lift this degeneracy, causing the well-known mode-splitting phenomenon [6]. It manifests as a doublet spectral response, i.e., two closely positioned symmetric Lorentzian responses with different linewidths, from which the scattering information including the frequency separation and mode loss between the two modes can be derived [7,8]. In practice, the exact knowledge and control of this scattering is significant, not only for high-quality photonics device characterization like SOI or -based integrated micro-ring [9,10], but also for developing a novel sensing method like mode-splitting self-referencing and exceptional point enhanced methods for sensing [8,11–14]. However, the doublet becomes obscured spectroscopically if an overlap between the mode field and the scatterer is too small, such that it becomes difficult to identify whether they are two closely positioned Lorentzian responses or a single response with degraded -factor. For example, this sets the size limit of the mode-splitting-based single nanoparticle detection to approximately 10 nm. There have been two sorts of approaches proposed to solve this issue. The first focuses on rendering the two modes lasing with a wavelength-dependent gain, and the frequency separation can be derived by detecting their beat frequency [15–17]. The second tends to associate the Rayleigh-scattering-induced frequency separation and mode loss with the modified doublet—for instance, revealing the two Lorentzian lineshapes by narrowing the linewidth with gain directly; exciting the doublet’s ringing spectrum to obtain a finer spectral profile for a better fitting or interfacing the CW and CCW propagating modes for separable detection of each split mode; and deriving mode loss from the broadened resonance linewidth [18–20]. In all these spectroscopical methods, spectral profile’s key features, i.e., the extremum and linewidth of a Lorentzian lineshape, are required to quantify the mode splitting accurately.
In photonic systems, there is a kind of asymmetric optical spectral response termed Fano resonance, when a discrete state interferes with a continuum of states. It is intensively studied because Fano’s asymmetry profile produces a steep spectrum, which can improve the performance of a resonance-based sensor; its complex lineshape changes also help to reveal the mode interaction involving phase information [21–24]. In the perspective of appearance, Fano has two extrema as its feature points, e.g., one local maximum () and one local minimum (), and they are frequency shifted from the only extremum of a Lorentzian dip (), as shown in Fig. 1(a). Recently, monitoring the Fano profile evolution emerges as a feasible method to reveal an exceptional point in photonic molecules and quantum coherence in the electron spin resonance [25,26]. Inspired by this, here we demonstrate the capability of Fano resonance in resolving ultra-small mode splitting in a WGM resonator, which is not resolvable from a Lorentz-based doublet. By introducing a coherent field onto the Rayleigh-scattering-induced back-scattering field, the unresolvable Lorentz-based doublet is converted into a Fano-based doublet, and both the frequency separation and mode loss information are revealed by fitting profile evolutions as a function of the coherent field’s phase and intensity. In addition, we further find that the frequency difference between the two key points of a Fano-based doublet increases monotonously with the increasing frequency separation, which shows potential for multiple nanoparticles detection with an ultra-low detection limit.
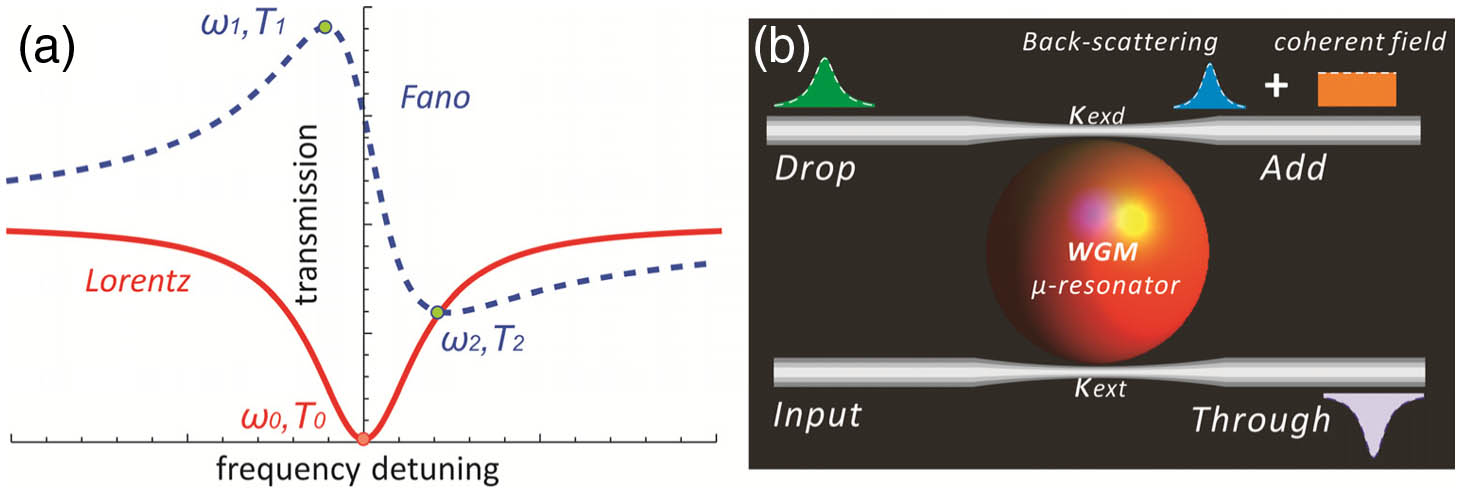
Figure 1.(a) Lineshape comparison between Lorentz (red line) and Fano (blue dotted line) with the same -factor. () is the extremum of the Lorentzian dip, and (), () are the two extrema of Fano. (b) Schematic diagram of the add-drop coupling configuration used here and its optical spectral responses. and denote the coupling rates of the in-through and add-drop fibers with the resonator, respectively. If there is Rayleigh-scattering-induced unresolvable mode splitting, the add port shows an upward Lorentzian peak.
2. EVOLUTION OF SINGLE FANO RESONANCE
It is clear that the interference between two coherent beams in free space produces pattern fringes, whereas coherent field interference in a resonant photonic system alerts not only the mode distribution, but also its spectral response. We first explore a coherent field’s function on a single Lorentzian spectral response before the one on the mode-splitting-induced doublet profile. Considering the add-drop coupling configuration composed of a microsphere resonator (diameter of approximately 240 μm in experiments) and two evanescently coupled tapered fibers as shown in Fig. 1(b), light from a tunable laser (Newport TLB-6728) passes a fiber splitter (90:10) first, and 10 percent of it is used as the input field to excite the resonance field , from the input port, and then the fields out of the through and drop ports are and , respectively. Here, denotes mode’s instinct loss, and denotes the frequency detuning between the resonance and input light. Transmission spectrum from through port is the coherent addition between the fields out of the resonator (a Lorentzian peak) and the one passing the fiber directly (a flat baseline), and it presents a Lorentzian dip due to their phase difference . Nevertheless, it is noted that this -phase-induced Lorentzian dip shows no advantage compared to a Lorentzian peak in discriminating ultra-small mode splitting. This is because their key points are both the Lorentzian extrema, and they merge together when mode splitting is smaller than the resonance linewidth. Therefore, we let the other 90 percent of the split light pass through a fiber-optic phase shifter (General Photonics) and a fiber-optic attenuator (Thorlabs) successively to produce a coherent field with varying phase and field intensity, and the interference with the drop port field is monitored using a photo receiver (Newport 1811-FC). The resulting spectrum obtained by laser frequency sweeping reveals the coherent field’s modulation on single Lorentzian response.
Sign up for Photonics Research TOC. Get the latest issue of Photonics Research delivered right to you!Sign up now
When a coherent field with amplitude and phase difference relative to the drop port field’s zero-detuning point is added, the output becomes . Here, the frequency-dispersion-induced phase shift is ignorable because of WGM’s narrow linewidth (as narrow as several MHz for -factor higher than ). As shown in Fig. 2(a), the addition of a coherent field modifies the spectral response profile into Fano at a period of , and the experimental evidence is presented in Fig. 2(b). The two extrema of the Fano profile, i.e., one minimum and one maximum, on both sides of the zero-detuning point, show opposite change tendencies as increases. Specifically, as increases from 0 to , the Lorentzian dip converts into Fano and becomes a Lorentzian peak at . During this process, the maximum shifts to zero-detuning point gradually, whereas the minimum shifts away from it. Further increase of from to turns the profile to Fano with opposite symmetry and finally back to the Lorentzian dip, where motions of the two extrema show opposite regularity compared with . Particularly, it is noted that either the maximum or minimum locates out of the range of FWHM/2 (FWHM, full width at half maximum) for an arbitrary phase. In addition, the amplitude ratio between two interference fields and has a strong influence on the lineshape. It manifests as the frequency shift of the key points, including the maximum, the minimum, as well as their difference . Specifically, for , the drop spectrum changes from the Lorentzian peak to the Lorentzian dip as the ratio increases, whereas the drop spectrum maintains a Lorentzian peak for with as an integer, the extreme experiences no shift. Otherwise, the extremum shifts monotonically away from or close to the central frequency of the initial Lorentzian peak and finally tends to a certain point when increases, as shown in Fig. 2(c). The amplitude ratio also changes the magnitude of the key point, as shown in Fig. 2(d). Both of the maximum and the minimum increase quickly with the increase of , but their difference only experiences a slow increase. In summary, a high amplitude ratio can produce a more observable Fano profile. Therefore, it is anticipated that this kind of modification, i.e., the frequency shift and intensity change of key points, would bring new feature points to two closely positioned resonances, which would facilitate ultra-small mode splitting identification.

Figure 2.(a) Dependence of the Fano profile on phase difference . The black dot denotes the maximum and the gray dot denotes the minimum. The extrema far away from the zero-detuning point are lost due to the limited plot range. (b) Fitted experimental results of a Fano periodical evolution. The fitting parameters are and . and are uniquely determined by fitting the transmission spectrum and the Fano profile simultaneously. The -factor of this resonance is approximately . (c), (d) Dependence of the frequency shift and intensity magnitude of the maximum, the minimum, and their difference on the amplitude ratio when . This phase is chosen as an example to illustrate the dependence, and for other phases except the integral multiple of , the key points show similar dependence.
3. IDENTIFICATION OF MODE SPLITTING
Following this process, we further demonstrate the influence of a coherent field on spectral responses consisting of two Lorentzian peaks. When they are far from each other in the frequency domain, i.e., when the frequency separation between two Lorentzian peaks exceeds their FWHMs, the two peaks seem to be independent, that is, each peak interacts with the coherent field individually like Fig. 2(a). Moreover, when the frequency separation is within their FWHMs, coherent field interference leads to complex profile evolutions, which ambitiously depends on the phase difference between the two resonances. For the Rayleigh-scattering-induced counter-propagating modes in a WGM resonator, they form symmetrical and asymmetrical standing wave modes around the scatterer, resulting in a phase difference between them [8]. In the coupling system of Fig. 1(b), resolvable mode splitting manifests as two Lorentzian dips at the through port and two Lorentzian peaks in both the drop port and add port. The back-scattering spectrum (i.e., add port here) indicates the two splitting modes inside the resonator directly are proved to experience lower noise [27], and thus, it is preferred to interact with a coherent field. When input field excites the CCW mode , scattering-induced back-propagating intracavity field amplitudes can be described by [8] where and denote the frequency and linewidth differences between the two resonances, respectively. In the parameter space of and , the back-scattering field from add port is , and it becomes with a coherent field added on, where the phase difference is relative to the asymmetrical mode.
Here, the spectral modulation of the coherent field on an unresolvable mode splitting is emphasized. We first focus on the dependence of profile evolution on phase difference . It manifests as on-resonance profile changes as increases from 0 to , as shown in Figs. 3(a)–3(d). Each profile can be understood as a combination of two individual lineshapes that are termed L-resonance and R-resonance for convenience of description. During the combination process, the original feature points within the frequency-overlapping region are replaced by new features; meanwhile, the feature points out of the overlapping region are preserved. Here, the L-resonance corresponds to the asymmetrical mode. At , the L-resonance (R-resonance) presents a Lorentzian peak, whereas the R-resonance (L-resonance) presents a Lorentzian peak under a low coherent field amplitude, and it turns to a Lorentzian dip as the amplitude increases. As a consequence, for near 0 and , the combination of a Lorentzian peak and dip produces a standard Fano lineshape, and they are mirror symmetric in Figs. 3(b) and 3(d). For near , each resonance individually shows the Fano profile with its minimum (maximum) out of the overlapping region, and their combination manifests as electromagnetically induced transparency (absorption)-like profile, as shown in Fig. 3(c) [Fig. 3(a)]. We then demonstrate the influence of the field amplitude ratio on spectral profile. Similar to the influence on a single Fano profile, an increase of the amplitude not only elevates the baseline, i.e., off-resonance response, but also highlights the on-resonance response as shown in Figs. 3(e) and 3(f), which makes the modified profile more observable and easily fitted. From these profiles, scattering information covered by the barely observed mode splitting in the transmission spectrum is revealed, giving the frequency separation and mode loss . Furthermore, it is found that these features are applicable to arbitrary small frequency separation because the key points out of the frequency overlapping region are always preserved theoretically, whereas spectral fluctuations caused by the instability of coherent field’s intensity and phase, coupling condition change, and baseline oscillating determine its detection limit in practical applications. Therefore, the introduction of a coherent field on the back-scattering spectrum modulates the spectral response of ultra-small mode splitting, that is, a single Lorentzian dip in the transmission spectrum as shown in Fig. 3(a) into a periodical Fano-based doublet, from which an accurate frequency separation and mode loss are feasible to derive by fitting these profiles. Additionally, this spectroscopic method is wavelength independent, i.e., applicable to any resonance experiencing Rayleigh scattering, and it provides another spectral analysis approach by relating the mode splitting to the Fano doublet’s extreme value frequency difference, as demonstrated in Section 4.
Figure 3.(a)–(d) Transmitting (yellow) and back-scattering (green) spectral responses for different relative phases . Solid lines are experimental results, and dotted lines are theoretical fittings. The mismatch is attributed to the laser power fluctuation and background modification induced by the fiber connectors. The parameters used in fitting are , , , normalized to the input field intensity, and and are slightly changed due to vibration-induced coupling condition changes. The -factors are approximately for the symmetrical mode and for the asymmetrical mode, respectively. Note that to achieve an unresolved doublet caused by a machining defect, a new microsphere resonator with a similar diameter was utilized. (e) Back-scattering spectral responses for different coherent field intensities (0.138, 0.196, and 0.285 normalized to the input field intensity) with a relative phase around . The profile becomes easily identifiable and immune against noise as the intensity increases. (f) Dependence of the intensity difference on the amplitude ratio. The red dotted line is the theoretical result using the experimental parameters.
4. DETECTION OF MULTIPLE NANOPARTICLES
In addition to the Fano doublet evolution, we further investigate the Fano-based mode-splitting-sensing capability for multiple ultra-small non-absorptive nanoparticles detection because of its potential in the identification of the tiny doublet. For particles smaller than tens of nanometers, the successive adsorption of nanoparticles is proved to result in an consecutive increase of and [8,28,29] and the ratio between the scattering-induced linewidth difference and frequency separation, i.e., is on the order of . It is thus important to get monotonous changes of spectral lineshape subject to . From the perspective of profile, a Fano-based doublet can be classified into two sorts, one with three feature points like Fig. 3(a), and the other with two like Fig. 3(b). Here we explore the relationship of frequency difference between the maximum and the minimum with , especially for the range under the condition of because of its easier identifiable extrema. As shown in Fig. 4, the frequency difference gives detectable signals for arbitrary small , and it increases monotonously as increases (solid line) for each coupling condition. The fitting shows that they have quasi-quadratic dependence on (dotted line), which are undoubtedly determined by the specific coupling coefficients. In addition, it is worth noting that though high , i.e., over-coupling, can enhance , it flattens the whole profile, making the extrema easily disturbed by the baseline fluctuations and reducing the spectral sensitivity at the same time. Therefore, Fano-based doublet provides us with multiple key points to deal with, and it not only preserves the self-referencing capability, which is immune to common-mode noises, but it also reveals conventionally unresolvable information. It is noted that there are more relationships that can be explored from these profiles, such as the intensity difference between the extreme, which may find applications in detecting absorptive medium.
Figure 4.Frequency difference between the two extrema of the Fano-based doublet for . Here starts from 0.2 MHz, , and equals 0.4, 14.5, and 20 for under-, critical-, and over-coupling conditions, respectively, and other parameters are the same as in the experiment. The fitting curves are , , and , respectively. The length of the fitting curve denotes the range for each condition.
5. CONCLUSIONS
In conclusion, we demonstrate the spectral feature of the Fano profile resulting from direct addition between a coherent field and one WGM resonance, and we further highlight the capability of Fano interference to identify arbitrary small-mode splitting caused by Rayleigh scattering in a WGM resonator. Analytical prediction and experimental results are developed and evidenced in a tapered fiber-microsphere coupling configuration. Finally, we illustrate theoretically the monotonous response of the Fano-based spectrum to the successive adsorption of ultra-small nanoparticle. It is known that there are many methods to achieve Fano resonance in a photonic coupling system [30,31], whereas the key to utilize Fano lies in the individual control of the coupled modes. Focusing on the approach introduced here, we believe that the Fano-interference-induced spectral modulation can be further investigated in the following fields: (i) it can be developed as a spectral method for ultra-small scatterer qualification in a high--factor resonator [9,10,32–35]; (ii) it can be used for mode identification in coupled photonic resonance systems, especially the phase information when they have close resonance frequencies [36]; and (iii) it may be a promising approach for a weakly coupled quantum system investigation [37,38].
Acknowledgment
Acknowledgment. The authors thank Kun Zhang for useful discussions and his instructions on the experiment.
References
[1] X.-F. Jiang, A. J. Qavi, S. H. Huang, L. Yang. Whispering gallery microsensors: a review(2018).
[2] S. Subramanian, H. Y. Wu, T. Constant, J. Xavier, F. Vollmer. Label-free optical single-molecule micro-and nanosensors. Adv. Mater., 30, 1801246(2018).
[3] G. P. Lin, A. Coillet, Y. K. Chembo. Nonlinear photonics with high-Q whispering-gallery-mode resonators. Adv. Opt. Photon., 9, 828-890(2017).
[4] M. Aspelmeyer, T. J. Kippenberg, F. Marquardt. Cavity optomechanics. Rev. Mod. Phys., 86, 1391-1452(2014).
[5] A. Pasquazi, M. Peccianti, L. Razzari, D. J. Mosset, S. Coen, M. Erkintalo, Y. K. Chembo, T. Hansson, S. Wabnitz, P. Del’Haye, X.-X. Xue, A. M. Weiner, R. Morandotti. Micro-combs: a novel generation of optical sources. Phys. Rep., 729, 1-81(2018).
[6] D. S. Weiss, V. Sandoghdar, J. Hare, V. S. Lefevre, J. M. Raimond, S. Haroche. Splitting of high-Q Mie modes induced by light backscattering in silica microspheres. Opt. Lett., 20, 1835-1837(1995).
[7] A. Mazzei, S. Götzinger, L. de S. Menezes, G. Zumofen, O. Benson, V. Sandoghdar. Controlled coupling of counterpropagating whispering-gallery modes by a single Rayleigh scatterer: a classical problem in a quantum optical light. Phys. Rev. Lett., 99, 173603(2007).
[8] J. G. Zhu, Ş. K. Özdemir, Y.-F. Xiao, L. Li, L. He, D.-R. Chen, L. Yang. On-chip single nanoparticle detection and sizing by mode splitting in an ultrahigh-Q microresonator. Nat. Photonics, 4, 46-49(2009).
[9] B. Stern, X. C. Ji, A. Dutt, M. Lipson. Compact narrow-linewidth integrated laser based on a low-loss silicon nitride ring resonator. Opt. Lett., 42, 4541-4544(2017).
[10] A. Li, W. Bogaerts. Backcoupling manipulation in silicon ring resonators. Photon. Res., 6, 620-629(2018).
[11] W. Chen, Ş. K. Özdemir, G. Zhao, J. Wiersig, L. Yang. Exceptional points enhance sensing in an optical microcavity. Nature, 548, 192-196(2017).
[12] H. Hodaei, A. U. Hassan, S. Wittek, H. Garcia-Gracia, R. El-Ganainy, D. N. Christodoulides, M. Khajavikhan. Enhanced sensitivity at higher-order exceptional points. Nature, 548, 187-191(2017).
[13] H. Jing, H. Lü, S. K. Özdemir, T. Carmon, F. Nori. Nanoparticle sensing with a spinning resonator. Optica, 5, 1424-1430(2018).
[14] W. Chen, J. Zhang, B. Peng, Ş. K. Özdemir, X. D. Fan, L. Yang. Parity-time-symmetric whispering-gallery mode nanoparticle sensor. Photon. Res., 6, A23-A30(2018).
[15] L. He, S. K. Ozdemir, J. Zhu, W. Kim, L. Yang. Detecting single viruses and nanoparticles using whispering gallery microlasers. Nat. Nanotechnol., 6, 428-432(2011).
[16] B.-B. Li, W. R. Clements, X.-C. Yu, K. Shi, Q. Gong, Y.-F. Xiao. Single nanoparticle detection using split-mode microcavity Raman lasers. Proc. Natl. Acad. Sci. USA, 111, 14657-14662(2014).
[17] S. K. Ozdemir, J. Zhu, X. Yang, B. Peng, H. Yilmaz, L. He, F. Monifi, S. H. Huang, G. L. Long, L. Yang. Highly sensitive detection of nanoparticles with a self-referenced and self-heterodyned whispering-gallery Raman microlaser. Proc. Natl. Acad. Sci. USA, 111, E3836-E3844(2014).
[18] M. Y. Ye, M. X. Shen, X. M. Lin. Ringing phenomenon based measurement of weak mode-coupling strength in an optical microresonator. Sci. Rep., 7, 17412(2017).
[19] J. Knittel, T. G. McRae, K. H. Lee, W. P. Bowen. Interferometric detection of mode splitting for whispering gallery mode biosensors. Appl. Phys. Lett., 97, 123704(2010).
[20] L. Shao, X.-F. Jiang, X.-C. Yu, B.-B. Li, W. R. Clements, F. Vollmer, W. Wang, Y.-F. Xiao, Q. Gong. Detection of single nanoparticles and lentiviruses using microcavity resonance broadening. Adv. Mater., 25, 5616-5620(2013).
[21] M. F. Limonov, M. V. Rybin, A. N. Poddubny, Y. S. Kivshar. Fano resonances in photonics. Nat. Photonics, 11, 543-554(2017).
[22] H. J. Goldwyn, K. C. Smith, J. A. Busche, D. J. Masiello. Mislocalization in plasmon-enhanced single-molecule fluorescence microscopy as a dynamical Young’s interferometer. ACS Photon., 5, 3141-3151(2018).
[23] S. Simoncelli, Y. Li, E. Cortés, S. A. Maier. Imaging plasmon hybridization of Fano resonances viahot-electron-mediated absorption mapping. Nano Lett., 18, 3400-3406(2018).
[24] N. Caselli, F. Intonti, F. L. China, F. Riboli, A. Gerardino, W. Bao, A. W. Bargioni, L. H. Li, E. H. Linfield, F. Pagliano, A. Fiore, M. Gurioli. Ultra-subwavelength phase-sensitive Fano-imaging of localized photonic modes. Light: Sci. Appl., 4, e326(2015).
[25] N. Caselli, F. Intonti, F. L. China, F. Biccari, F. Riboli, A. Gerardino, L. H. Li, E. H. Linfield, F. Pagliano, A. Fiore, M. Gurioli. Generalized Fano lineshapes reveal exceptional points in photonic molecules. Nat. Commun., 9, 396(2018).
[26] P. Willke, W. Paul, F. D. Natterer, K. Yang, Y. Bae, T. Choi, J. Fernández-Rossier, A. J. Heinrich, C. P. Lutz. Probing quantum coherence in single-atom electron spin resonance. Sci. Adv., 4, eaaq1543(2018).
[27] J. Knittel, J. D. Swaim, D. L. McAuslan, G. A. Brawley, W. P. Bowen. Back-scatter based whispering gallery mode sensing. Sci. Rep., 3, 2974(2013).
[28] X. Yi, Y. F. Xiao, Y. C. Liu, B. B. Li, Y. L. Chen, Y. Li, Q. H. Gong. Multiple-Rayleigh-scatterer-induced mode splitting in a high-Q whispering-gallery-mode microresonator. Phys. Rev. A, 83, 023803(2011).
[29] Y. L. Xu, S. J. Tang, X. C. Yu, Y. L. Chen, D. Q. Yang, Q. H. Gong, Y. F. Xiao. Mode splitting induced by an arbitrarily shaped Rayleigh scatterer in a whispering-gallery microcavity. Phys. Rev. A, 97, 063828(2018).
[30] Y. C. Liu, B. B. Li, Y. F. Xiao. Electromagnetically induced transparency in optical microcavities. Nanophotonics, 6, 789-811(2017).
[31] K. Zhang, Y. Wang, Y. H. Wu. Enhanced Fano resonance in a non-adiabatic tapered fiber coupled with a microresonator. Opt. Lett., 42, 2956-2959(2017).
[32] X. W. Liu, A. W. Bruch, Z. Gong, J. J. Lu, J. B. Surya, L. Zhang, J. X. Wang, J. C. Yan, H. X. Tang. Ultra-high-Q UV microring resonators based on a single-crystalline AlN platform. Optica, 5, 1279-1282(2018).
[33] L. Wang, C. Wang, J. Wang, F. Bo, M. Zhang, Q. H. Gong, M. Lončar, Y. F. Xiao. High-Q chaotic lithium niobate microdisk cavity. Opt. Lett., 43, 2917-2920(2018).
[34] G. Lin, R. Henriet, A. Coillet, M. Jacquot, L. Furfaro, G. Cibiel, L. Larger, Y. K. Chembo. Dependence of quality factor on surface roughness in crystalline whispering-gallery mode resonators. Opt. Lett., 43, 495-498(2018).
[35] A. E. Shitikov, I. A. Bilenko, N. M. Kondratiev, V. E. Lobanov, A. Markosyan, M. L. Gorodetsky. Billion Q-factor in silicon WGM resonators. Optica, 5, 1525-1528(2018).
[36] R. B. Wu, Y. Zheng, Q. M. Chen, Y. X. Liu. Synthesizing exceptional points with three resonators. Phys. Rev. A, 98, 033817(2018).
[37] R. J. Thompson, G. Rempe, H. J. Kimble. Observation of normal-mode splitting for an atom in an optical cavity. Phys. Rev. Lett., 68, 1132-1135(1992).
[38] M. Rossi, N. Kralj, S. Zippilli, R. Natali, A. Borrielli, G. Pandraud, E. Serra, G. Di Giuseppe, D. Vitali. Normal-mode splitting in a weakly coupled optomechanical system. Phys. Rev. Lett., 120, 073601(2018).


