
Daojing Li, Xuan Hu, Kai Zhou, Yuan Yao, Ming Qiao. Synthetic Aperture Lidar Imaging Detection Based on Conformal Diffractive Optical System[J]. Acta Optica Sinica, 2020, 40(4): 0428001
- Acta Optica Sinica
- Vol. 40, Issue 4, 0428001 (2020)
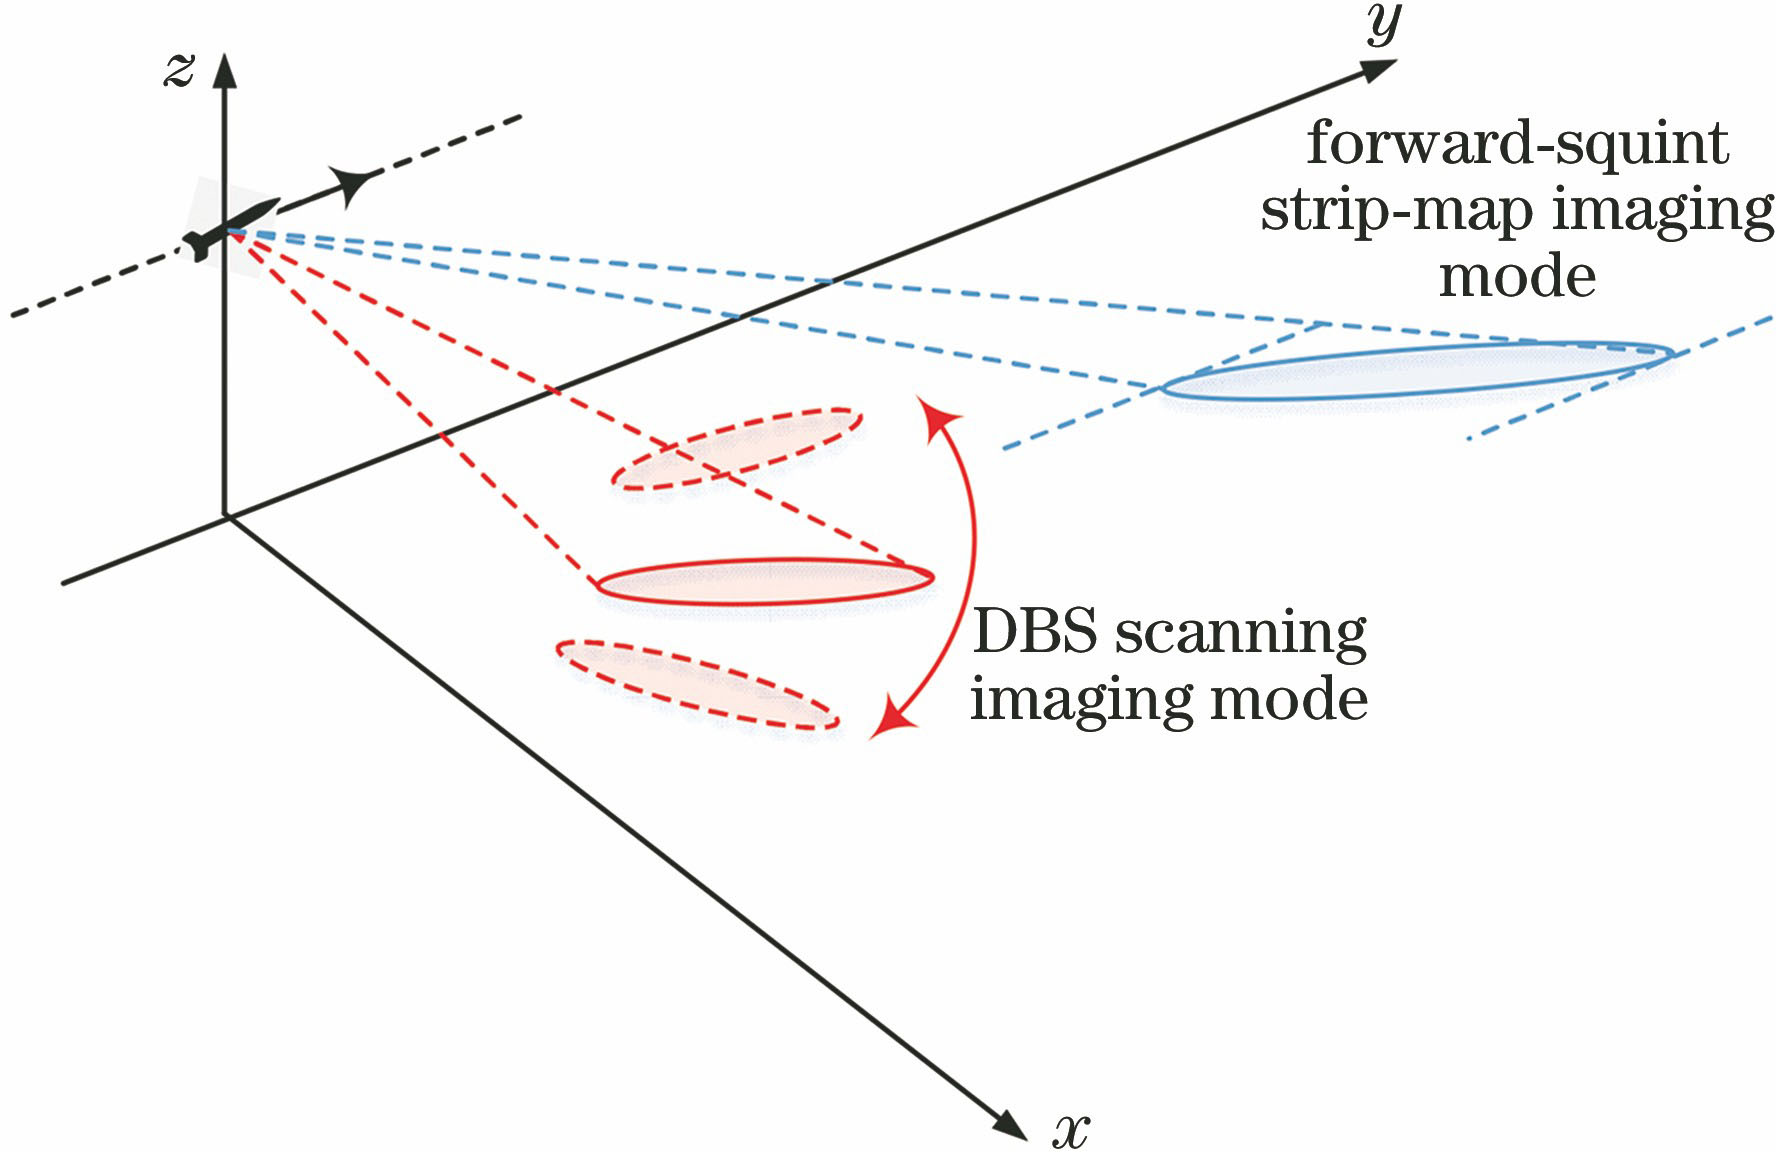
Fig. 1. Diagram of forward-squint strip-map imaging and DBS imaging mode
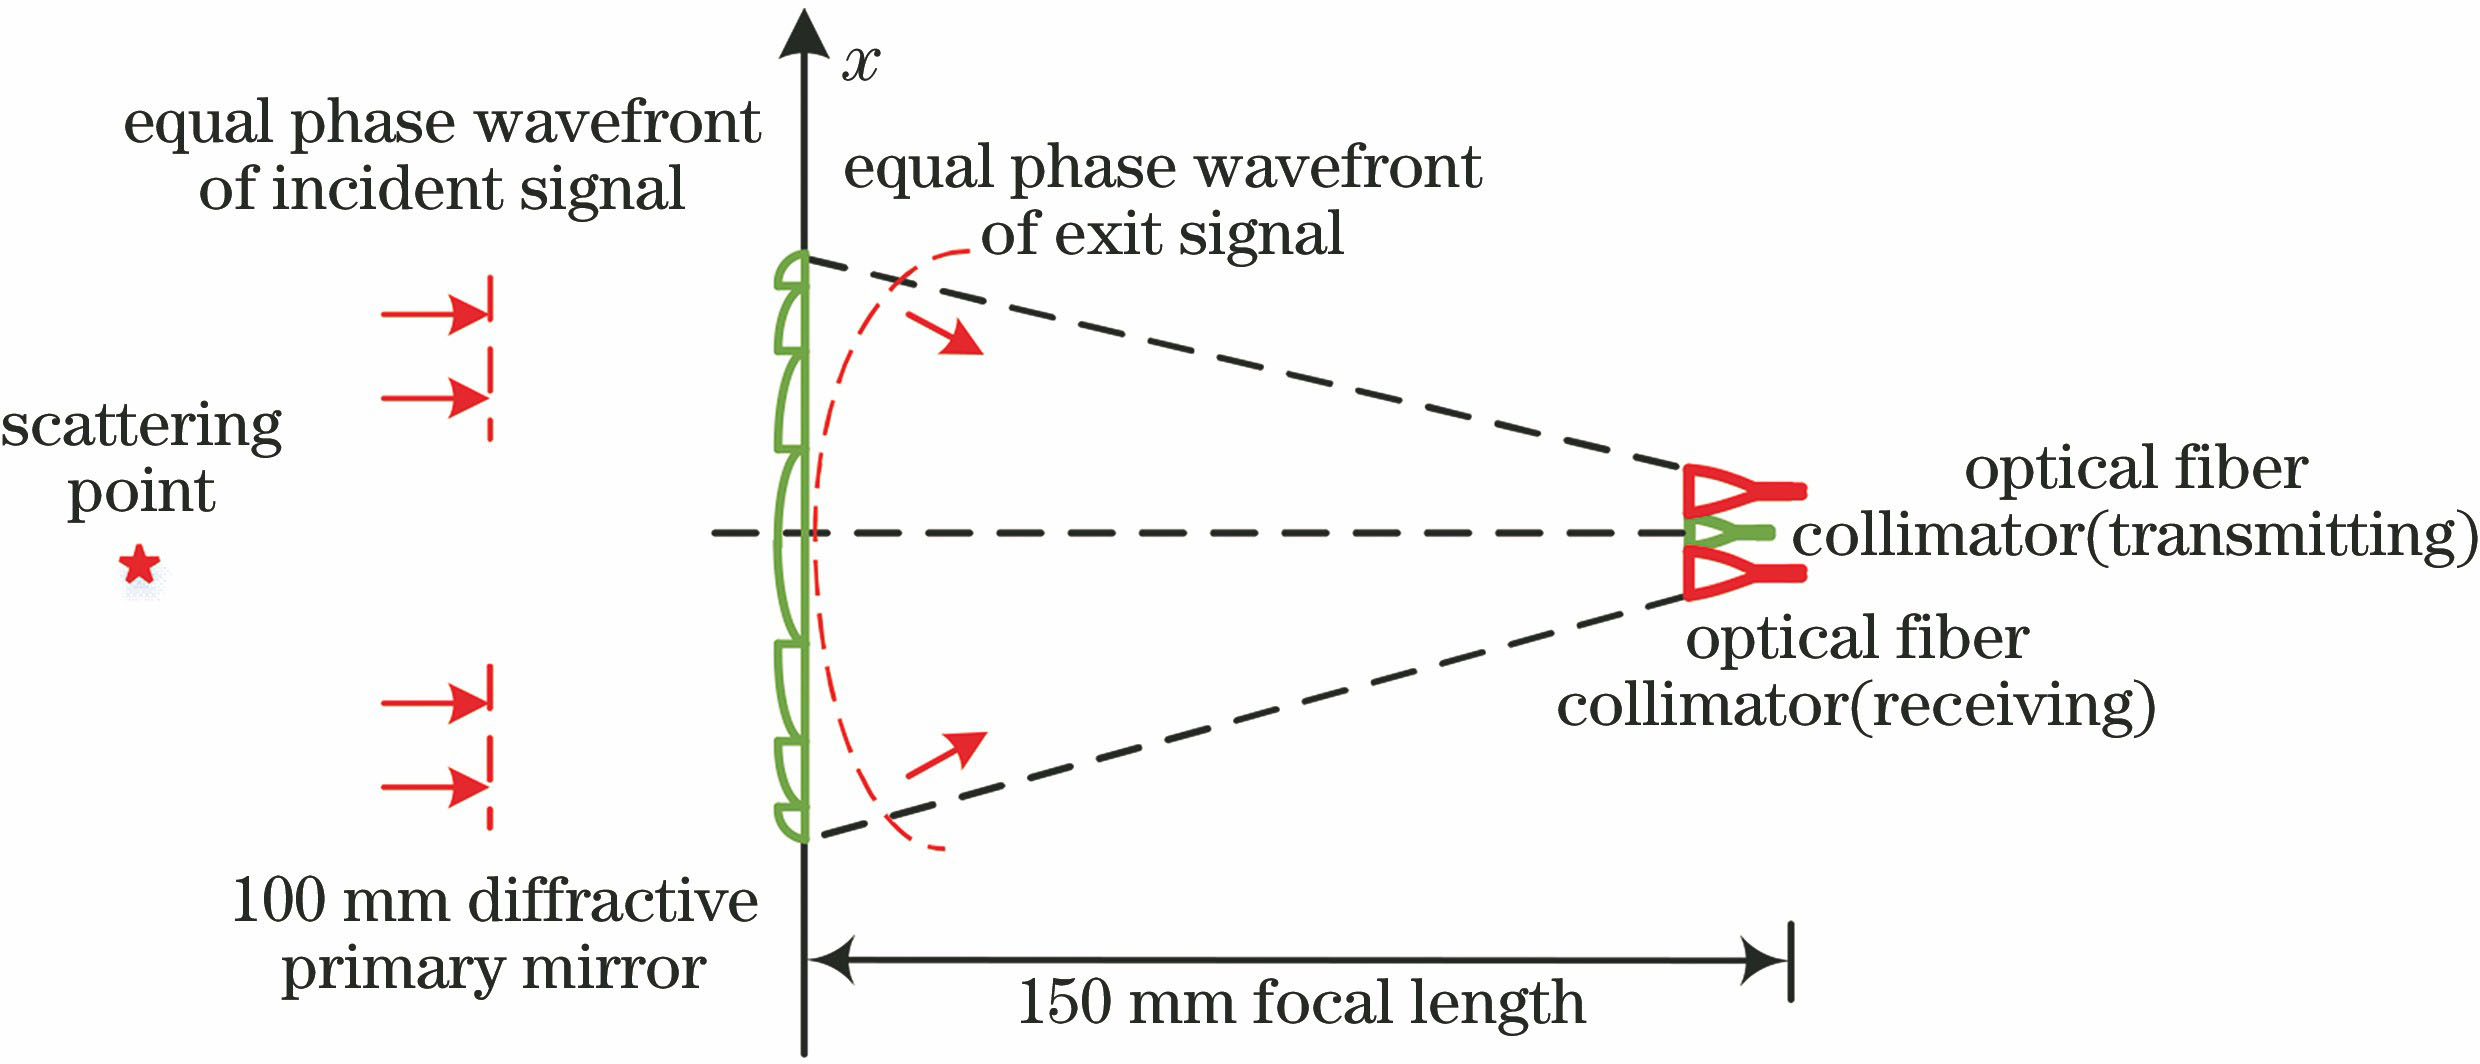
Fig. 2. SAL transmissive diffractive optical system and collimator feeder
Fig. 3. One-transmitting and four-receiving feeder layout
Fig. 4. Transmitting and receiving field-of-view formed by one-transmitting and four-receiving
Fig. 5. Geometric model of planar diffractive optical system
Fig. 6. Folded phase curve and beam pattern of diffractive primary mirror. (a) Phase curve without fold; (b) phase curve folded by 2π; (c) beam pattern in ±60° range; (d) beam pattern in ±0.01° range
Fig. 7. Phase curve and beam pattern of primary mirror after four quantization. (a) Phase curve of central radiation unit; (b) phase curve of left radiation unit; (c) beam pattern in ±60° range; (d) beam pattern in ±0.01° range
Fig. 8. Planar diffractive optical system
Fig. 9. Diagram of optical system for frequency scanning to achieve beam scanning
Fig. 10. Beam pattern corresponding to different wavelengths. (a) 1.0140 μm; (b) 1.0640 μm; (c) 1.1140 μm
Fig. 11. Diagram of optical system for frequency scanning to achieve beam scanning when focus deviates from axis of main mirror
Fig. 12. Beam pattern when wavelengths are 1.0133, 1.0640, and 1.1200 μm
Fig. 13. Beam pattern when wavelengths are 0.9672, 1.0640 and 1.1822 μm
Fig. 14. Beam pattern corresponding to different wavelengths. (a)(b) 1.0640 μm; (c)(d) 1.0638 μm; (e)(f) 1.0636 μm
Fig. 15. Geometric model of curved-conformal diffractive optical system
Fig. 16. Phase curve and beam pattern of curved-conformal diffractive primary mirror. (a) Phase curve without fold; (b) beam pattern in ±60° range; (c) beam pattern in ±0.01° range
Fig. 17. Wave path difference and phase error between curved-conformal diffractive primary mirror and planar primary mirror. (a) Wave path difference; (b) phase error
Fig. 18. Optical path diagram of laser beam one-dimensional frequency scanning
Fig. 19. Optical path diagram of curved-conformal diffractive optical system for laser beam two-dimensional scanning
|
Table 1. SAL system parameters for strip-map imaging
|
Table 2. SAL system parameters for DBS imaging

Set citation alerts for the article
Please enter your email address
© Copyright 2018-2021 | Chinese Laser Press. All Rights Reserved 沪ICP备15018463号-20