• Photonics Research
  • Vol. 7, Issue 11, 1331 (2019)
Lei Gao1、4、*, Yulong Cao1, Stefan Wabnitz2、3, Hongqing Ran1, Lingdi Kong1, Yujia Li1, Wei Huang1, Ligang Huang1, Danqi Feng1, and Tao Zhu1、5、*
Author Affiliations
  • 1Key Laboratory of Optoelectronic Technology and Systems (Ministry of Education), Chongqing University, Chongqing 400044, China
  • 2Dipartimento di Ingegneria dell’Informazione, Elettronica e Telecomunicazioni, Sapienza Università di Roma, 00184 Rome, Italy
  • 3Novosibirsk State University, Novosibirsk 630090, Russia
  • 4e-mail: gaolei@cqu.edu.cn
  • 5e-mail: zhut@cqu.edu.cn
  • show less
    DOI: 10.1364/PRJ.7.001331 Cite this Article Set citation alerts
    Lei Gao, Yulong Cao, Stefan Wabnitz, Hongqing Ran, Lingdi Kong, Yujia Li, Wei Huang, Ligang Huang, Danqi Feng, Tao Zhu. Polarization evolution dynamics of dissipative soliton fiber lasers[J]. Photonics Research, 2019, 7(11): 1331 Copy Citation Text show less
    Schematic of the fiber laser cavity and measurement methods.
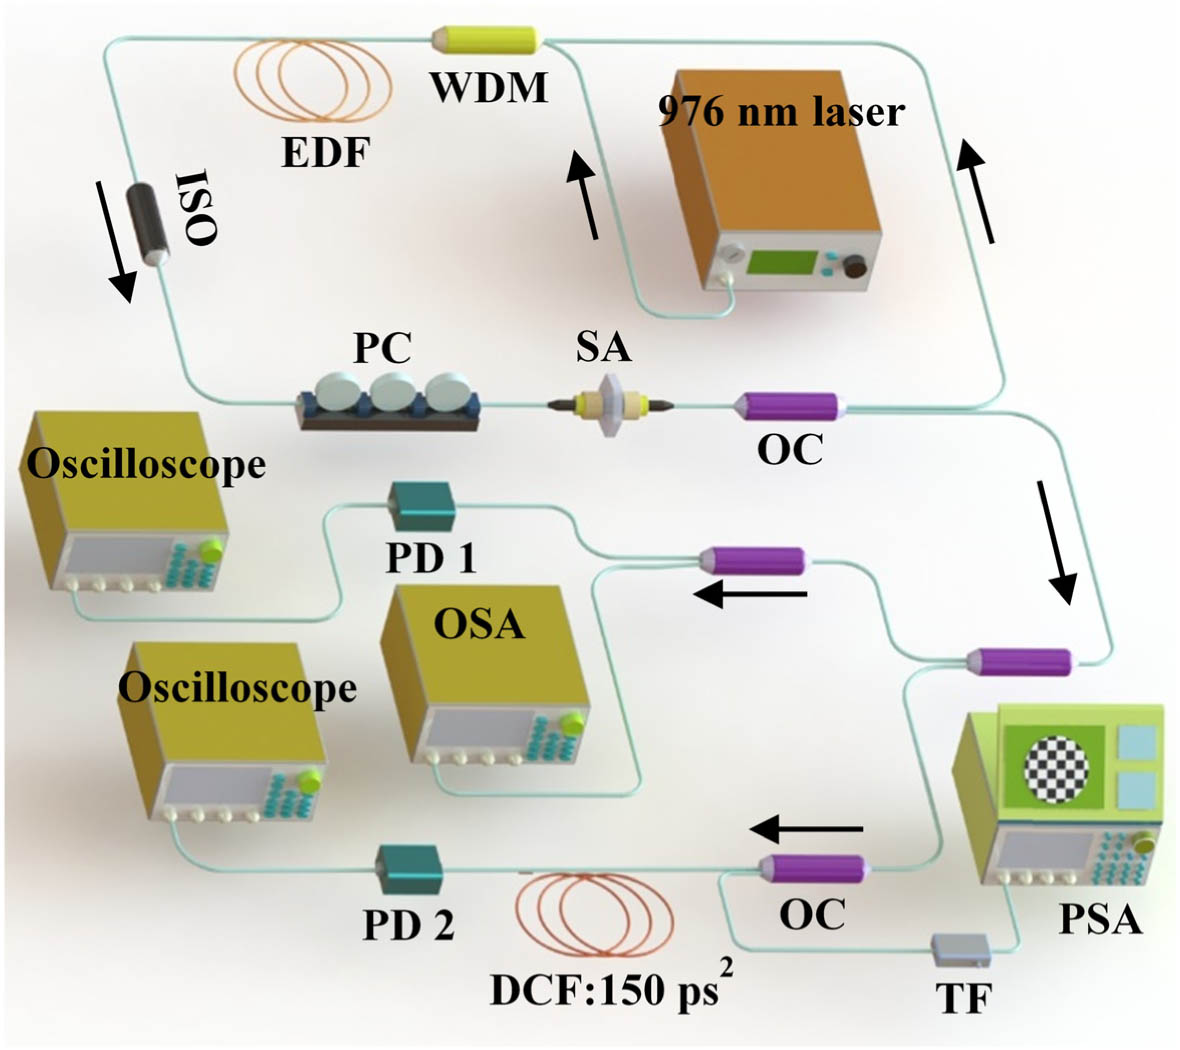
    Fig. 1. Schematic of the fiber laser cavity and measurement methods.
    Average output power under different pump powers, where unstable pulse (below 53 mW), DS (53–66 mW), and DS explosion (above 66 mW) are observed.
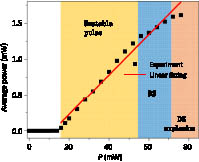
    Fig. 2. Average output power under different pump powers, where unstable pulse (below 53 mW), DS (53–66 mW), and DS explosion (above 66 mW) are observed.
    Typical outputs for laser pulses. (a)–(d) Averaged optical spectra for various pump powers. (e) Averaged optical spectrum for a pump power of 35 mW, in linear scale. (f) Autocorrelation trace of DS for a pump power of 55 mW, fitted by a Gaussian function. (g) RF spectrum at the fundamental frequency of 11.48 MHz. The inset is the RF spectrum within a broader range, and an envelope is shown due to the mismatching of the PD and the RF spectrum analyzer.
    Fig. 3. Typical outputs for laser pulses. (a)–(d) Averaged optical spectra for various pump powers. (e) Averaged optical spectrum for a pump power of 35 mW, in linear scale. (f) Autocorrelation trace of DS for a pump power of 55 mW, fitted by a Gaussian function. (g) RF spectrum at the fundamental frequency of 11.48 MHz. The inset is the RF spectrum within a broader range, and an envelope is shown due to the mismatching of the PD and the RF spectrum analyzer.
    (a)–(c) Conservative single-shot spectra in the buildup of a DS for pump powers of 35, 45, and 70 mW, respectively. The corresponding 3D plots in (d)–(f) indicate giant peaks with rogue intensities in the spectral domain. Due to limited splicing error of long time series into pieces, a slight tilt is shown in the single-shot spectra. All intensities are normalized with respect to the maximum value in each detection. The first round-trip is determined by the trigging level of the real-time oscilloscope during DFT detection. (g) Integrated normalized energy for the pulsed component in the single-shot spectra for different pump powers, fitted by a Gaussian shape. The number of round-trips is shifted, so that maximum energies are realigned at the same position. (h) Spliced single-shot spectra for (c), where a DS explosion with giant intensity occurs. The dotted line indicates the position of the DS. The intensity is in logarithm scale.
    Fig. 4. (a)–(c) Conservative single-shot spectra in the buildup of a DS for pump powers of 35, 45, and 70 mW, respectively. The corresponding 3D plots in (d)–(f) indicate giant peaks with rogue intensities in the spectral domain. Due to limited splicing error of long time series into pieces, a slight tilt is shown in the single-shot spectra. All intensities are normalized with respect to the maximum value in each detection. The first round-trip is determined by the trigging level of the real-time oscilloscope during DFT detection. (g) Integrated normalized energy for the pulsed component in the single-shot spectra for different pump powers, fitted by a Gaussian shape. The number of round-trips is shifted, so that maximum energies are realigned at the same position. (h) Spliced single-shot spectra for (c), where a DS explosion with giant intensity occurs. The dotted line indicates the position of the DS. The intensity is in logarithm scale.
    Evolution of SOPs for various filtered wavelengths and different pump powers. (a)–(e) Normalized Stokes parameters represented on the Poincaré sphere for pump powers of 35, 45, 55, 67.5, and 70 mW, respectively. Specifically, (c) depicts four detections for a pump power of 55 mW, where the absolute SOP entering the PSA is changed arbitrarily through biasing the fiber between output OC and the PSA.
    Fig. 5. Evolution of SOPs for various filtered wavelengths and different pump powers. (a)–(e) Normalized Stokes parameters represented on the Poincaré sphere for pump powers of 35, 45, 55, 67.5, and 70 mW, respectively. Specifically, (c) depicts four detections for a pump power of 55 mW, where the absolute SOP entering the PSA is changed arbitrarily through biasing the fiber between output OC and the PSA.
    (a)–(c), (e), (f) Phase diagrams based on the ellipticity angle χ and spherical orientation angle ψ, corresponding to the SOPs of various filtered wavelengths and different pump powers in Figs. 5(a)–5(e). (d) Phase diagram for a stable DS, where the pump power is either 55 mW (circled dots), 60 mW (rectangle dots), or 65 mW (star dots), respectively. The SOPs on the edges of the spectrum exhibit fluctuations.
    Fig. 6. (a)–(c), (e), (f) Phase diagrams based on the ellipticity angle χ and spherical orientation angle ψ, corresponding to the SOPs of various filtered wavelengths and different pump powers in Figs. 5(a)5(e). (d) Phase diagram for a stable DS, where the pump power is either 55 mW (circled dots), 60 mW (rectangle dots), or 65 mW (star dots), respectively. The SOPs on the edges of the spectrum exhibit fluctuations.
    Average relative distances of SOPs of laser wavelengths as a function of pump power. An exponential convergence towards a fixed point is observed. Error bars represent absolute errors based on experimental data, which are relatively high for lower pump powers.
    Fig. 7. Average relative distances of SOPs of laser wavelengths as a function of pump power. An exponential convergence towards a fixed point is observed. Error bars represent absolute errors based on experimental data, which are relatively high for lower pump powers.
    Histograms of the relative distance, r, between points on the Poincaré sphere for 70 mW pump power, when DS explosion deteriorates its high coherence. Large deviations from a Gaussian distribution indicate the presence of optical polarization rogue waves, which can also be certified by the SWH.
    Fig. 8. Histograms of the relative distance, r, between points on the Poincaré sphere for 70 mW pump power, when DS explosion deteriorates its high coherence. Large deviations from a Gaussian distribution indicate the presence of optical polarization rogue waves, which can also be certified by the SWH.
    Lei Gao, Yulong Cao, Stefan Wabnitz, Hongqing Ran, Lingdi Kong, Yujia Li, Wei Huang, Ligang Huang, Danqi Feng, Tao Zhu. Polarization evolution dynamics of dissipative soliton fiber lasers[J]. Photonics Research, 2019, 7(11): 1331
    Download Citation