Abstract
Dissipative solitons emerge as stable pulse solutions of nonintegrable and nonconservative nonlinear physical systems, owing to a balance of nonlinearity, dispersion, and loss/gain. A considerable research effort has been dedicated to characterizing amplitude and phase evolutions in the spatiotemporal dynamics of dissipative solitons emerging from fiber lasers. Yet, the picture of the buildup process of dissipative solitons in fiber lasers is incomplete in the absence of corresponding information about the polarization evolution. Here, we characterize probabilistic polarization distributions in the buildup of dissipative solitons in a net-normal dispersion fiber laser system, mode-locked by single-wall carbon nanotubes. The output optical spectra under different pump powers are filtered by a tunable filter, and are detected by a polarization state analyzer. The laser system operates from random amplified spontaneous emission into a stable dissipative soliton state as the cavity gain is progressively increased. Correspondingly, the state of polarization of each spectral wavelength converges towards a fixed point. To reveal the invariant polarization relationship among the various wavelength components of the laser output field, the phase diagram of the ellipticity angle and the spherical orientation angle is introduced. We find that, within the central spectral region of the dissipative soliton, the state of polarization evolves with frequency by tracing a uniform arc on the Poincaré sphere, whereas in the edges of the dissipative soliton spectrum, the state of polarization abruptly changes its path. Increasing cavity gain leads to spectral broadening, accompanied by a random scattering of the state of polarization of newly generated frequencies. Further increases of pump power result in dissipative soliton explosions, accompanied by the emergence of a new type of optical polarization rogue waves. These experimental results provide a deeper insight into the transient dynamics of dissipative soliton fiber lasers.1. INTRODUCTION
Solitons are spatiotemporal localized wave structures, associated with analytical solutions of conservative and integrable systems, such as the nonlinear Schrödinger equation (NLSE), where the interaction of nonlinearity and diffraction/dispersion is balanced [1]. In optics, NLSE-based soliton laser systems possess a high degree of coherence, due to the well-defined phases among the various longitudinal laser modes. Solitons propagate with a transform-limited pulse duration and collide with each other while maintaining their shapes and velocities. Yet, most natural systems occur as dissipative and nonintegrable. Various localized structures, such as self-similar pulses, gain-guided pulses, dissipative solitons, and even sporadic rogue waves, proliferate and decay with a diverse range of spatial-temporal periodic and localized structures [2–4].
Dissipative solitons (DSs) are highly coherent solutions of nonlinear wave equations, and arise from a balance among nonlinearity, dispersion, and loss/gain [1–4]. At variance with NLSE solitons in integrable fiber systems operating in the anomalous dispersion regime, DSs in dissipative fiber laser systems operating in the normal dispersion regime exhibit extremely complex and striking dynamics. For example, DSs have much broader (when compared with solitons) pulse durations and linear phase chirping, which makes them ideal for high energy ultrafast fiber lasers and phase-dependent optical processing. Moreover, their flat and broad optical spectrum provides an excellent platform for high coherent laser sources. Extensive theoretical analyses of DSs in mode-locked fiber laser systems have been performed [5], while direct experiments on their buildup dynamics were often restricted by relatively slow detection techniques. Based on the well-developed dispersive Fourier transform (DFT) method, nonrepetitive spectra of optical signals are transformed into temporal data under the far-field approximation. As a result, the spectral properties of DSs, soliton explosions, soliton molecules, modulation instability, and supercontinuum could be characterized [6–14]. Similarly, the time-lens method, which utilizes the temporal analogue of a spatial lens, has recently been exploited for the characterization of the real-time temporal properties of transient DSs [15,16]. However, the consistence of amplitude and phase measurements in spatiotemporal transient dynamics relies on the assumption of a strict correspondence between temporal and spectral domains. The validity of such assumption is suspicious in transient optical dynamics, where the optical phases may be loosely locked, or even irrelevant. It is reliable to use DFT for single-shot spectrum detection. However, it is suspicious for the continuous wave (CW) part. This is especially important in the proliferating period of DSs, where, both CW part and pulsed part continuously evolve in the laser cavity. Besides, few studies have been conducted to investigate the state of polarization (SOP) of fiber lasers, where the SOP of longitudinal modes may be a random variable [17–22]. The lack of a proper SOP characterization entails that a full picture of the buildup dynamics of DS is still incomplete.
In this work, we experimentally investigate the probabilistic nature of the SOP distributions in the buildup dynamics of DSs. DSs proliferate from random noise in a fiber ring laser cavity with net normal dispersion, which is mode-locked by a saturable absorber (SA) made from single-wall carbon nanotubes. We characterize the probabilistic SOP distribution by introducing the phase diagram of the ellipticity angle and of the spherical orientation angle . We reveal an inversely exponential distribution of the SOP with increasing cavity gain, and investigate the fine structure of the various spectral components of a stable DS. A new kind of polarization optical rogue waves could be identified, when the high coherence of the DS is deteriorated by imposing a progressively higher cavity gain.
Sign up for Photonics Research TOC. Get the latest issue of Photonics Research delivered right to you!Sign up now
2. MAIN PRINCIPLE AND SETUP
Figure 1 schematically depicts the ring fiber cavity containing 15 m erbium-doped fiber (EDF, Nufern, EDFC-980-HP), forward pumped by a 976 nm continuous wave laser through a wavelength division multiplexer (WDM), a polarization independent optical isolator (ISO), a polarization controller (PC), 2.7 m of single mode fiber (SMF), and an optical coupler (OC) with a 10% output port. The dispersion parameters of the EDF and SMF are and 18 ps/(nm·km), respectively. Therefore, the total 17.8 m ring cavity possesses a net normal dispersion of . The saturable absorbing film is made by mixing 10 wt% aqueous polyvinyl alcohol and 0.5 mg/mL single-wall-carbon-nanotubes solution at a volume ratio of 1:2, and then dehydrated in vacuum [23]. Its nonlinear optical response is measured by means of a home-made balanced two-detector, as described in Ref. [24]. The modulation depth and the saturation power are 3.5% and , respectively [23]. This low saturation power permits our laser system to operate in a DS regime with relatively low pump powers. At the same time, the DSs become unstable at relatively high pump powers, owing to the bleaching effect of the SA.
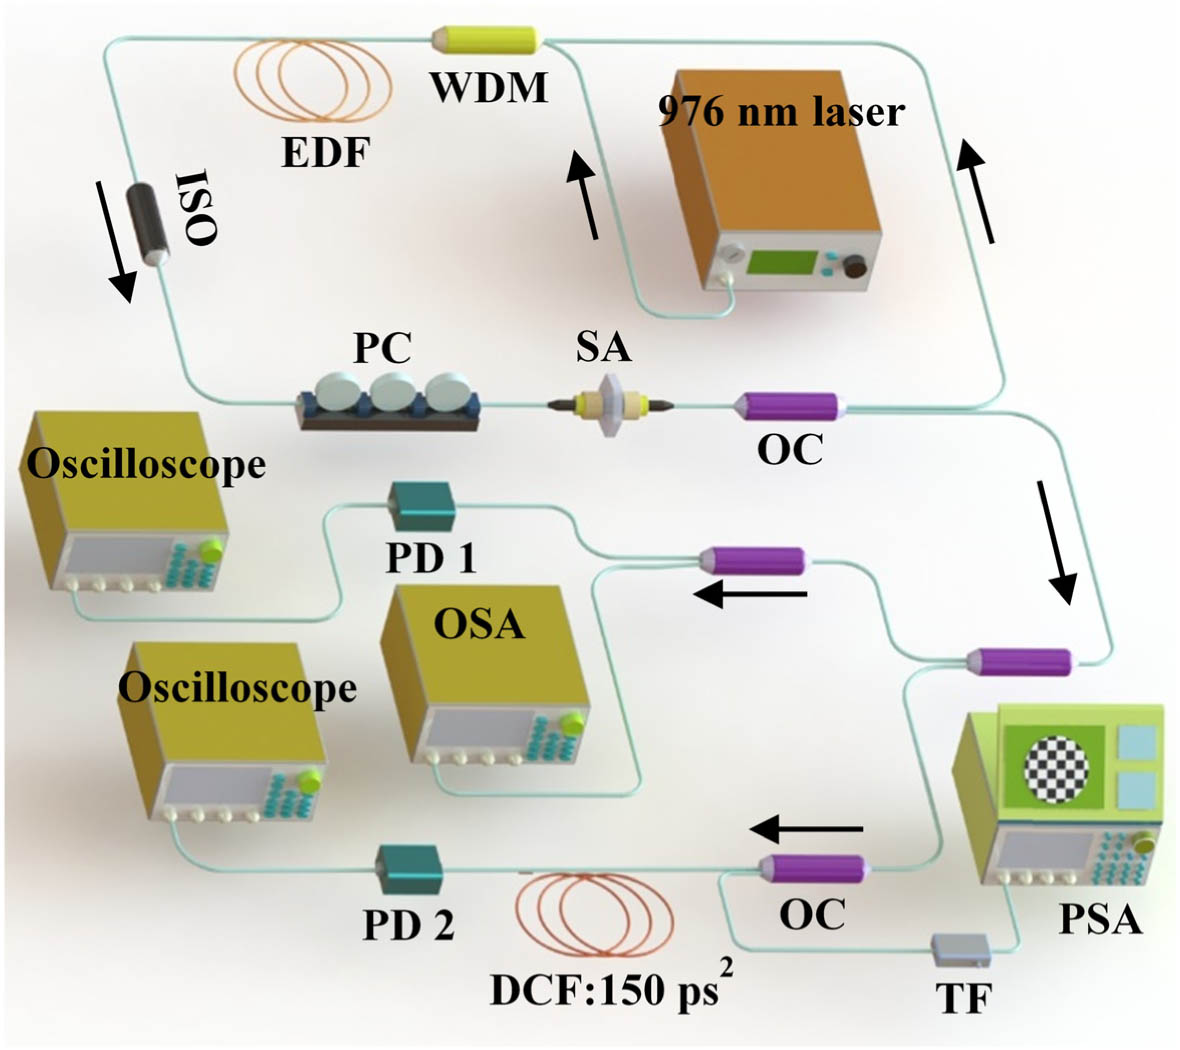
Figure 1.Schematic of the fiber laser cavity and measurement methods.
The laser output is characterized by an optical spectrum analyzer (OSA, Yokogawa, AQ6370), an autocorrelator (APE, Pulse check USB 150), an oscilloscope (Lecroy, SDA 8600A), and a radio-frequency (RF) spectrum analyzer (Agilent, PSA E4447A), together with a photodetector (PD1) with a bandwidth of 350 MHz. The wavelength dependence of the SOP of the DS is measured by a high-speed polarization state analyzer (PSA, General Photonics, PSGA-101-A), after filtering the DS spectrum by a tunable optical filter (TF, Santec, OTF-320) with a bandwidth of 0.2 nm. Meanwhile, we also detect the laser single-shot spectra by means of a home-made DFT, where periodic signals are stretched by a 500 m dispersion compensation fiber (DCF) with the dispersion of for the frequency-to-time transformation, and subsequently fed to a 50 GHz PD2 connected to a real time oscilloscope (Tektronix, DPO 71254) with the bandwidth of 12.5 GHz. Therefore, the resolution of the DFT is mainly limited by the sampling rate of the electronic digitizer, and the overall resolution is about 0.2 nm [6].
3. RESULTS AND DISCUSSION
For the configuration in Fig. 1, pulses with different operating stages are observed for various pump powers. The average output power as a function of pump power is depicted in Fig. 2. We only observe stable DSs for the range of pump powers between 53 and 66 mW, beyond which unstable emission is detected. For example, we observe a varying optical spectrum for pump powers below 53 mW, whereas the DS spectrum broadens for pump powers above 66 mW. The experimental data are fitted linearly, and a coefficient of determination () of 0.98 is obtained. We notice that the relation between average power and pump power is nonlinear, because the slope efficiencies, , for the three operation regimes (indicated by different background colors in Fig. 2) are slightly different: the for stable DS emission is smaller than that for unstable pulse emission, and larger than that corresponding to the DS explosion regime. The different slope efficiencies originate from distinct laser dynamics under diverse pump powers.

Figure 2.Average output power under different pump powers, where unstable pulse (below 53 mW), DS (53–66 mW), and DS explosion (above 66 mW) are observed.
In Figs. 3(a)–3(e), we plot the detected optical spectra for different pump powers. For pump powers smaller than 53 mW, the laser operates from random amplified spontaneous emission into an unstable pulse regime, until it enters into a stable DS regime. For the unstable pulse regime, we observe a giant CW component, located on the spectrally broadened edge of the pulsed component, as clearly seen in the optical spectrum in the linear scale of Fig. 3(e). By further increasing the pump power, one gradually broadens the optical spectrum, as shown by the corresponding spectra in Fig. 3(c) for pump powers of 55, 60, and 65 mW, respectively. A too large pump-induced gain deteriorates the mode-locking state. This deterioration is identified directly from the noisy newly emerged frequencies in the two fronts of the DS optical spectrum of Fig. 3(d). These frequency components originate from stochastic longitudinal laser modes mixing via the nonlinear optical response of the fabricated SA with a low saturation power.
Figure 3.Typical outputs for laser pulses. (a)–(d) Averaged optical spectra for various pump powers. (e) Averaged optical spectrum for a pump power of 35 mW, in linear scale. (f) Autocorrelation trace of DS for a pump power of 55 mW, fitted by a Gaussian function. (g) RF spectrum at the fundamental frequency of 11.48 MHz. The inset is the RF spectrum within a broader range, and an envelope is shown due to the mismatching of the PD and the RF spectrum analyzer.
Typical laser output spectrum for stable DS with a pump power of 55 mW is depicted in Fig. 3(c), where the rectangle-shaped optical spectrum with a full width at half maximum (FWHM) of 13.6 nm is shown. The autocorrelation trace in Fig. 3(f) exhibits an FWHM duration of 30.5 ps, when fitted by a Gaussian function. During the autocorrelation measurement, the 1.3 mW average power is amplified by a commercial high gain erbium-doped fiber amplifier (AEDFA-23-B-FA, Amonic) up to 20 mW. We may notice an abnormal background of the autocorrelation trace, which deviates from the expected background ratio of 8:1 for collinear interferometric autocorrelation. This could originate from the misalignment of the scanning devices in the autocorrelator, or from noise induced by the amplification. Gaussian fitting of the intensity profile is performed by the accessory software embedded within the autocorrelator. Nevertheless, the imperfection in our pulse duration detection does not affect our main discussions and their associated conclusions, as we mainly analyze the SOP. The signal to noise ratio at the fundamental frequency of 11.48 MHz exceeds 70 dB.
To further explore the intrinsic transient dynamics of the laser cavity, in Fig. 4 we display consecutive single-shot optical spectra. Real-time optical spectra corresponding to those in Figs. 3(a), 3(b), and 3(d) exhibit fine structures, which are invisible in the averaged optical spectrum. For example, Fig. 4(a) shows that a broad optical spectrum is formed for a pump power of 35 mW. In fact, the laser system includes both a pulsed component and a CW component. The DFT technique can only reveal the dynamics of the pulsed component, because it is based on the far-field approximation, under the assumption of large dispersion. As we see, the optical spectrum grows larger by drawing energy from the CW component, until it decays swiftly due to insufficient cavity gain, similar to the optical puff which is generated in partially mode-locked laser systems [11,13]. Interestingly, Fig. 4(a) shows the generation of new frequencies in the short wavelength side of the laser spectrum, owing to wave mixing among the bright spectral stripes, while a giant spectral feature appears in the central wavelength region. Following the formation of a spectral peak, the whole broad spectrum collapses abruptly, until the laser energy returns back to the CW component, resulting into a near zero-value mapping when detected by the DFT. In contrast with the previously described behavior, Fig. 4(b) shows that, as the pump power grows to 45 mW, the optical spectrum gradually broadens, until two giant peaks appear in the two edges of the spectrum. These peaks draw their energy from the CW component, and they progressively red-shift and blue-shift as the number of circulations grows larger, respectively. In the meantime, intense multiple mode mixing occurs between the two peaks, as also seen in Fig. 4(e), where varying bright stripes intersect within successive roundtrips. After reaching a peak value, the optical spectrum decays under further cavity circulations, albeit with a slower rate when compared with that of Fig. 4(a). The energy of the pulsed component flows back into the CW component.
Figure 4.(a)–(c) Conservative single-shot spectra in the buildup of a DS for pump powers of 35, 45, and 70 mW, respectively. The corresponding 3D plots in (d)–(f) indicate giant peaks with rogue intensities in the spectral domain. Due to limited splicing error of long time series into pieces, a slight tilt is shown in the single-shot spectra. All intensities are normalized with respect to the maximum value in each detection. The first round-trip is determined by the trigging level of the real-time oscilloscope during DFT detection. (g) Integrated normalized energy for the pulsed component in the single-shot spectra for different pump powers, fitted by a Gaussian shape. The number of round-trips is shifted, so that maximum energies are realigned at the same position. (h) Spliced single-shot spectra for (c), where a DS explosion with giant intensity occurs. The dotted line indicates the position of the DS. The intensity is in logarithm scale.
Until now, cavity gain is not sufficient to support a stable DS, so that irregular clusters proliferate and decay at various rates in a memoryless manner, which only depends on the pump-power level. In fact, the single-shot spectra are not repetitive technically. The pulses proliferate from the noise, and they go through different processes. However, they have similar behaviors for specific pump power. The single-shot spectra in Figs. 4(a)–4(f) are picked as representatives for the different pump powers. Yet, our results show that a great difference exists between a partially mode-locked laser and a DS [13]. Here, we integrate the energy of the pulsed component as revealed by the DFT in each round trip. Figure 4(g) reveals that the proliferation (or growth) time and decay time are always the same for all three pump powers. This phenomenon is different from the critical behavior that is observed for the generation of optical puff associated with the onset of optical turbulence, where, in general, growth and decay times are different [13]. For a specific stage of the process leading to a transition to turbulence, a critical point is shown. This point defines the boundary for the outweight of two competing processes, below which the system is unable to sustain turbulence and is relaminarized, and vice versa [13]. The reason is that the underlying physics of the two types of lasers are different: the evolution of the optical puff in a partially mode-locked fiber laser system is only associated with the presence of multiple-mode mixing [11,13]. The formation of an optical cluster in a dissipative fiber laser system is more complex, involving nonlinearity, dispersion, and loss/gain. In its decaying regions, energy does not gradually couple into the central part of the spectrum as it occurs for the optical puff, but rather it collapses swiftly into the CW component.
For pump powers between 55 and 65 mW, the laser operates in a stable DS regime. Yet, its average intensity during single-shot spectrum detection is much smaller than that of unstable pulses as in Figs. 4(a), 4(b), and 4(d). Due to the large formation time, and the limited storage depth of our real-time oscilloscope, we could not detect the process of formation of a stable DS. Yet, this information has been carefully studied via single-shot detection based on DFT [4,8]. Instead, our attention is devoted to the polarization dynamics in the buildup of DS, for various pump levels.
For a pump power of 70 mW, regular DSs with neatly rectangle-shaped optical spectra are frequently detected, just as they occur for pump powers between 55 and 65 mW. Yet, much broader optical spectra persisting near the square spectrum may also be occasionally encountered, exhibiting two extremely high peaks. One such example is shown in Figs. 4(c) and 4(f). After the spectral collapse, the DS returns to its neat square spectral shape, albeit with a much lower intensity. In this case, the entire transient evolution process takes place within 50 round-trips. Limited by the low dynamic range of the high speed PD2, the intensity of the single-shot spectrum of a stable DS is too low, when compared with the extremely high intensities of the transient stage. The giant intensity contrast is clearly shown by the spliced single-shot spectra in Fig. 4(h) within the 30th, 250th, and 137th round-trips. The spectra in the former two round-trips correspond to DSs, whereas that in the 137th round-trip reveals the ultralarge spectral intensity that is formed during the DS explosion. For soliton explosions, the balance of nonlinearity, dispersion, and loss/gain for the DS is perturbed by the surplus cavity gain at large pump powers [25]. Part of the DS energy dissipates into CWs via the explosion, and the DS maintains its property of a highly coherent pulse. Based on thousands of detection times, we find that the probability for these giant peaks increases with cavity gain, and the transient evolution will take a longer time to return into the DS region.
Our experimental data initiate a question: why cannot the DS further broaden its spectrum indefinitely, as the pump power is progressively raised, as it occurs in the case of a DS resonance [26]? To ascertain the response to this question, we need to reconsider how new frequencies are generated in the process leading to a DS, from stochastic amplified spontaneous emission (ASE) noise, in the process leading to the well-known linear phase relationship among the frequency components of a DS. Although single-shot spectra of DSs have been reported before, the characteristics of the exact SOP distribution of the longitudinal modes of the laser may provide an additional insight for reconstructing the buildup process of a DS. This information is especially important in the primary buildup stage, where the DFT method fails, due to the random phase relationship among the laser modes.
Therefore, we measured the SOPs of different filtered wavelengths from the dissipative fiber laser cavity, for various levels of pump power. Figure 5 illustrates the resulting SOP distributions for the cases in Fig. 3. It is clear from the distribution of points on the Poincaré sphere that the corresponding SOPs for each wavelength are evolving from a random cloud into a fixed narrow domain as the pump power grows larger. When a stable DS is formed, a well-defined SOP trajectory versus frequency is observed on the Poincaré sphere. As shown in Fig. 5(c) for a pump power of 55 mW, this structure is preserved; the absolute value of the SOP entering the PSA is changed arbitrarily by biasing the fiber between the output OC and the PSA.
Figure 5.Evolution of SOPs for various filtered wavelengths and different pump powers. (a)–(e) Normalized Stokes parameters represented on the Poincaré sphere for pump powers of 35, 45, 55, 67.5, and 70 mW, respectively. Specifically, (c) depicts four detections for a pump power of 55 mW, where the absolute SOP entering the PSA is changed arbitrarily through biasing the fiber between output OC and the PSA.
Whereas for pump powers above 66 mW, the SOPs of unstable DSs exhibit fluctuations [Fig. 5(d)], for even stronger pump powers [Fig. 5(e)], these intense fluctuations trend to be spreading more on the Poincaré sphere, especially for frequencies located on the two spectral edges, such as 1564 nm. The instability and fluctuations of SOPs on the two edges of the spectrum reveal a new aspect of the complex dynamics in DS formation, which so far has been largely unnoticed.
The SOP of each wavelength, namely, of the various longitudinal DS laser modes, may abruptly vary even within a single-shot round-trip. To guarantee the accuracy of the SOP measurements as precisely as possible, we would need to filter each longitudinal mode by an ideal TF with a bandwidth ranging between 11.48 and 22.96 MHz (the fundamental repetition frequency of the DS being 11.48 MHz). However, the TF that we used here has a bandwidth as large as 0.2 nm. Therefore, about 2100 longitudinal modes are detected simultaneously, so that the SOP detection is averaged among 2100 neighboring longitudinal modes. Besides, the detection bandwidth of the PSA should be larger than 11.48 MHz. The commercial PSA that we used works on a fast speed mode, and it outputs . Yet, the bandwidth of the photodetector in the PSA is in a MHz scale, and the sampling rate is mainly limited by the processing circuit. Namely, the PSA obtains sampled values with a sampling rate of 40 Hz from a quasi-real-time detection with a bandwidth of MHz. Most importantly, we have performed the same detection with another high-speed PSA (Novoptel, PM1000-100M-XL-FA-N2-D). This device has a bandwidth of 23 MHz, and the same results on the polarization dynamics are observed. These experimental results prove the reliability of our SOP detection.
The characteristics of the SOP distribution are more apparent in a phase diagram for the ellipticity angle and the spherical orientation angle ψ, which are calculated as follows: Here, , , and are the Stokes parameters of the laser SOP. At variance with the case of partial mode-locking [11], neither a bifurcation nor fully developed turbulence can be identified here. As shown in Fig. 6(a), the SOPs follow a random distribution for 35 mW of pump power, where ASE dominates. Yet, Fig. 6(b) shows that for a pump power of 45 mW, all SOPs are located within a well-defined region of the phase diagram for and , although they still behave erratically. A quasi-V shaped SOP distribution is shown, where the DS is not stable because of insufficient cavity gain.
Figure 6.(a)–(c), (e), (f) Phase diagrams based on the ellipticity angle and spherical orientation angle , corresponding to the SOPs of various filtered wavelengths and different pump powers in Figs. 5(a)–5(e). (d) Phase diagram for a stable DS, where the pump power is either 55 mW (circled dots), 60 mW (rectangle dots), or 65 mW (star dots), respectively. The SOPs on the edges of the spectrum exhibit fluctuations.
Further increasing the pump power leads to stable DS operation. As shown in Fig. 6(c), a well-defined, rectangle-shaped optical spectrum results in a fixed SOP distribution along a folding trajectory. The SOP distribution in the phase diagram of and remains invariant, even if the birefringence induced by the fiber between the output OC and the polarization state analyzer is changed. The SOP phase diagram for wavelengths in the central region of the DS shows that all points are aligned on a straight line. Whereas SOPs of wavelengths in the blue side of the DS spectrum exhibit a similar behavior, they evolve in a different direction. The reason is the wavelength-dependence of the filtering film in the TF. Limited by the manufacturing process of the tunable filter, we can only tune the wavelength continuously from 1563 nm to 1574 nm, beyond which a sudden abrupt switching of the SOP for longer wavelengths is introduced by the TF. Yet, we also observe a similar distribution in the phase diagram for wavelength larger than 1575 nm. In other words, both long and short wavelength sides of the DS spectrum exhibit SOPs that are varying with frequency along different directions with respect to the SOP evolution with frequency of the main spectrum.
In general, larger cavity gains will broaden the optical spectrum of a stable DS, by generating additional frequencies on both the long and the short wavelength sides of its spectrum. This spectral broadening can be verified in Fig. 3(c), and its corresponding phase diagrams are depicted in Fig. 6(d). In this case, we find that new wavelengths on both the long and short wavelength sides of the DS spectrum exhibit irregular SOP values, which depart from the SOP distribution observed at the center of the DS spectrum. These fluctuations originate from an energy exchange among the 2100 longitudinal modes that are filtered by the TF. On the other hand, SOPs corresponding to the central region of the DS spectrum are shifted only slightly with pump power.
For example, when the pump power is 65 mW, the SOPs of new frequencies on the edges of the DS spectrum become unstable, even though the DS spectrum remains stable as a whole. Those experimental results point to a change of the energy redistribution among lasing wavelengths, as the cavity gain is varied. So far, these phenomena have hardly been taken into account in theoretical models for dissipative mode-locked laser systems. Besides, the occurrence of SOPs varying within different directions on the two edges of the spectrum has not been fully considered when using DS for practical applications such as pulse compression, amplification, pump-probing, and supercontinuum generation.
A more general problem that is frequently encountered in our experiments is DS deterioration when the cavity gain becomes large enough. In our case, this means for pump powers beyond 70 mW, the corresponding optical spectrum is shown in Fig. 3(d). Its corresponding SOP information on the Poincaré sphere and in the SOP phase diagram is depicted in Figs. 5(d), 5(e) and Figs. 6(e), 6(f). During DS explosion, it is clear that more frequencies with extremely large or rogue SOP fluctuations in the phase diagram are observed. Besides, the probability for generating frequencies exhibiting such freak SOPs seems to increase as the gain grows larger. This trend is obvious when comparing the averaged spectrum in Fig. 3(d) with the single-shot spectra in Fig. 4(c), where new frequencies on the two edges of the soliton spectrum are generated with abnormally high intensities. In the stage of DS explosion, the laser system cannot be self-sustaining. Also, new frequencies with rogue SOPs are fundamentally different from frequencies generated when the cavity gain is insufficient. For example, quasi-DSs are frequently encountered for a pump power at 45 mW; however, no freak SOP distribution was observed across the entire lasing spectrum.
To quantitatively characterize the SOP distribution in the buildup of a DS, we evaluate a dimensionless parameter, , describing the relative distance between any two arbitrary points of the SOP distribution. It represents the distance between two different Stokes vectors, namely We calculated the average value of for different cavity gains by averaging among a large number of independent detections. Figure 7 plots for various filtered wavelengths in the blue-shifted portion of the DS spectrum (curves in the red-shifted portion are not shown because they are symmetric with respect to the blue shifted ones). As for each wavelength, the relative distance converges exponentially with pump power into a fixed point. Wavelengths away from the central region of the DS spectrum exhibit a reduced convergence rate. The main reason for the observed convergence of rave values into a fixed point is that the laser cavity changes its operating point from a low coherent amplified spontaneous emission state into a highly coherent dissipative soliton state, as pump power is increasing. A similar exponential convergence during the coherence transition was observed for the pulse energy in the buildup process of a femtosecond mode-locked fiber laser [7], where the coherence of laser emission evolves from low to high values. Another example of exponential convergence is provided by the condensate lifetime in a laminar-turbulent transition, where coherence evolves from high to low values [20]. We believe that such an exponential dependence is an intrinsic property of any nonlinear system undergoing a coherence transition from a chaotic into a coherent state.
Figure 7.Average relative distances of SOPs of laser wavelengths as a function of pump power. An exponential convergence towards a fixed point is observed. Error bars represent absolute errors based on experimental data, which are relatively high for lower pump powers.
It is interesting to evaluate the probability density function (PDF) of when the DS is deteriorated at high pump powers. As seen in Fig. 8, the PDF has a quasi-Gaussian shape at the 1568 nm wavelength (in the center region of the DS spectrum). This PDF is associated with the DS, although it may be disturbed by dissipative soliton explosions. Howbeit, for wavelengths far away from the DS spectral center, a trend develops towards the generation of L-shaped PDFs, which characterize the emergence of extreme events in the polarization domain, rather than in time or frequency domains [19,27–32]. In other words, the irregular SOP of a deteriorated DS is associated with the emergence of a new type of optical rogue waves in the polarization dimension, namely optical polarization rogue waves (PRWs) [13]. From the point of view of their measurement in the phase histogram in Figs. 6(e) and 6(f), such rogue events appear with both unexpected SOP values and relatively large probabilities of occurrence [19]. From a statistical point of view, the occurrence of polarization rogue waves can be testified by the emergence of a heavy tail in the measured histogram. We present in Fig. 8 the significant wave height (SWH), which is defined as the mean amplitude of the highest third of the waves. As shown for the 1568 nm wavelength, 1.8% of the events have a value that is larger than twice the SWH. Whereas rogue events represent about 3.8% of the events at the 1564 nm wavelength, these observations lead us to anticipate that the probability of PRWs could be even larger as the cavity gain (or pump level) is further increased.
Figure 8.Histograms of the relative distance, , between points on the Poincaré sphere for 70 mW pump power, when DS explosion deteriorates its high coherence. Large deviations from a Gaussian distribution indicate the presence of optical polarization rogue waves, which can also be certified by the SWH.
There is an important consideration to make regarding the identification of rogue waves in the polarization domain. The observation of heavy tailed statistics does not always prove the presence of rogue waves. For example, phase diagrams in Figs. 5(a) and 5(b) may exhibit a non-Gaussian distribution; however, they are not conclusive concerning the presence of rogue waves. Only nonlinear physics provides a platform to generate rogue waves, which exhibit abnormally large probabilities, deviating from Gaussian statistics. For the case with a pump power of 70 mW [Fig. 6(f)], the large cavity gain perturbs the DS. New frequencies with irregular SOPs are generated during the DS explosion, which provides a highly nonlinear process that can generate rogue waves in spectral domain (ultrabroad spectrum), temporal domain (ultrahigh intensity), and polarization domain (ultrafar SOP position). Here, we observe tails that extend significantly beyond the Gaussian tails. Moreover, the corresponding coefficients of determination, , also denote the existence of rogue SOPs for all three wavelengths in Fig. 8. Therefore, we may confidently identify the emergence of polarization rogue waves in the process of DS explosion.
4. CONCLUSIONS
We experimentally investigated the dynamics of polarization evolution in DS fiber lasers, mode-locked by a single-wall carbon nanotube. When the cavity gain is increased, the laser emission evolves from a random ASE into a stable DS state. Correspondingly, the SOPs of all laser modes converge to a fixed point, with an exponential convergence rate as the pump power is increased. By introducing the phase diagram of the ellipticity and spherical orientation angles, we find that the SOP in the central region of the DS evolves with frequency along a smooth trajectory on the Poincaré sphere, whereas SOPs cross the two edges of the spectrum evolve with frequency in different directions with respect to the evolution of the central spectrum. Larger gains lead to spectral broadening, and the SOPs of newly generated frequencies are randomly scattered. Further increases of the pump power result in DS deterioration, and lead to the observation of soliton explosions. We identified the occurrence of a new type of polarization optical rogue waves, associated with a strong heavy tail in the measured SOP histogram, and identified through the SWH method. Our experimental results provide a new insight into the transient dynamics of DS fiber lasers, which is of fundamental interest for proper theoretical modeling, as well as for the technological applications of fiber lasers, pump-probe spectroscopy techniques, and supercontinuum sources. The observation of soliton explosions and associated polarization rogue waves in DS lasers also provides a new perspective into the still hotly debated topic of the mechanism for rogue wave generation.
References
[1] P. Grelu, N. Akhmediev. Dissipative solitons for mode-locked lasers. Nat. Photonics, 6, 84-92(2012).
[2] J. M. Dudley, F. Dias, M. Erkintalo, G. Genty. Instabilities, breathers and rogue waves in optics. Nat. Photonics, 8, 755-764(2014).
[3] C. Lecaplain, P. Grelu, J. M. Soto-Crespo, N. Akhmediev. Dissipative rogue waves generated by chaotic pulse bunching in a mode-locked laser. Phys. Rev. Lett., 108, 233901(2012).
[4] W. H. Renninger, A. Chong, F. W. Wise. Dissipative solitons in normal-dispersion fiber lasers. Phys. Rev. A, 77, 023814(2008).
[5] N. Akhmediev, A. Ankiewicz. Dissipative Solitons(2005).
[6] K. Goda, B. Jalali. Dispersive Fourier transformation for fast continuous single-shot measurements. Nat. Photonics, 7, 102-112(2013).
[7] G. Herink, B. Jalali, C. Ropers, D. R. Solli. Resolving the build-up of femtosecond mode-locking with single-shot spectroscopy at 90 MHz frame rate. Nat. Photonics, 10, 321-326(2016).
[8] H. J. Chen, M. Liu, J. Yao, S. Hu, J. B. He, A. P. Luo, W. C. Xu, Z. C. Luo. Buildup dynamics of dissipative soliton in an ultrafast fiber laser with net-normal dispersion. Opt. Express, 26, 2972-2982(2018).
[9] K. Krupa, K. Nithyanandan, P. Grelu. Vector dynamics of incoherent dissipative optical solitons. Optica, 4, 1239-1244(2017).
[10] Z. Liu, S. Zhang, F. W. Wise. Rogue waves in a normal-dispersion fiber laser. Opt. Lett., 40, 1366-1369(2015).
[11] L. Gao, T. Zhu, S. Wabnitz, M. Liu, W. Huang. Coherence loss of partially mode-locked fiber laser. Sci. Rep., 6, 24995(2016).
[12] D. V. Churkin, S. Sugavanam, N. Tarasov, S. Khorev, S. V. Smirnov, S. M. Kobtsev, S. K. Turitsyn. Stochasticity, periodicity and localized light structures in partially mode-locked fiber lasers. Nat. Commun., 65, 700(2015).
[13] L. Gao, T. Zhu, S. Wabnitz, Y. Li, X. S. Tang, Y. L. Cao. Optical puff mediated laminar-turbulent polarization transition. Opt. Express, 26, 6103-6113(2018).
[14] T. Godin, B. Wetzel, T. Sylvestre, L. Larger, A. Kudlinski, A. Mussot, A. B. Salem, M. Zghal, G. Genty, F. Dias, J. M. Dudley. Real time noise and wavelength correlations in octave-spanning supercontinuum generation. Opt. Express, 21, 18452-18460(2013).
[15] P. Suret, R. E. Koussaifi, A. Tikan, C. Evain, S. Randoux, C. Szwaj, S. Bielawski. Single-shot observation of optical rogue waves in integrable turbulence using time microscopy. Nat. Commun., 7, 13136(2016).
[16] P. Ryczkowski, M. Närhi, C. Billet, J. M. Merolla, G. Genty, J. M. Dudley. Real-time full-field characterization of transient dissipative soliton dynamics in a mode-locked laser. Nat. Photonics, 12, 221-227(2018).
[17] S. V. Sergeyev, C. Mou, E. G. Turitsyna, A. Rozhin, S. K. Turitsyn. Spiral attractor created by vector solitons. Light Sci. Appl., 3, e131(2014).
[18] D. Li, D. Shen, L. Li, D. Tang, L. Su, L. Zhao. Internal polarization dynamics of vector dissipative-soliton-resonance pulses in normal dispersion fiber lasers. Opt. Lett., 43, 1222-1225(2018).
[19] D. R. Solli, C. Ropers, P. Koonath, B. Jalali. Optical rogue waves. Nature, 450, 1054-1057(2007).
[20] E. G. Turitsyna, S. V. Smirnov, S. Sugavanam, N. Tarasov, X. Shu, S. A. Babin, E. V. Podivilov, D. V. Churkin, G. Falkovich, S. K. Turitsyn. The laminar-turbulent transition in a fiber laser. Nat. Photonics, 7, 783-786(2013).
[21] V. Kalashnikov, S. V. Sergeyev, G. Jacobsen, S. Popov, S. K. Turitsyn. Multi-scale polarisation phenomena. Light Sci. Appl., 5, e16011(2016).
[22] C. Mou, S. V. Sergeyev, A. G. Rozhin, S. K. Turitsyn. Bound state vector solitons with locked and processing states of polarization. Opt. Express, 21, 26868-26875(2013).
[23] Y. J. Li, L. Gao, T. Zhu, Y. L. Cao, M. Liu, D. R. Qu, F. Qiu, X. B. Huang. Graphene-assisted all-fiber optical-controllable laser. IEEE J. Sel. Top. Quantum, 24, 0901709(2018).
[24] L. Gao, T. Zhu, W. Huang, Z. Luo. Stable, ultrafast pulse mode-locked by topological insulator Bi2Se3 nanosheets interacting with photonic crystal fiber: from anomalous dispersion to normal dispersion. IEEE Photon. J., 7, 3300108(2015).
[25] A. F. J. Runge, N. G. R. Broderick, M. Erkintalo. Observation of soliton explosions in a passively mode-locked fiber laser. Optica, 2, 36-39(2015).
[26] W. Chang, A. Ankiewicz, J. M. Soto-Crespo, N. Akhmediev. Dissipative soliton resonances. Phys. Rev. A, 78, 023830(2008).
[27] K. Hammani, B. Kibler, C. Finot, A. Picozzi. Emergence of rogue waves from optical turbulence. Phys. Lett. A, 374, 3585-3589(2010).
[28] D. R. Solli, G. Herink, B. Jalali, C. Ropers. Fluctuations and correlations in modulation instability. Nat. Photonics, 6, 463-468(2012).
[29] M. Onorato, S. Residori, U. Bortolozzo, A. Montina, F. T. Arecchi. Rogue waves and their generating mechanisms in different physical contexts. Phys. Rep., 528, 47-89(2013).
[30] J. P. Eckmann. Roads to turbulence in dissipative dynamical systems. Rev. Mod. Phys., 53, 643-654(1981).
[31] A. Picozzi, J. Garnier, T. Hansson, P. Suret, G. Randoux, G. Millot, D. N. Christodoulides. Optical wave turbulence: towards a unified nonequilibrium thermodynamic formulation of statistical nonlinear optics. Phys. Rep., 542, 1-132(2014).
[32] S. A. Kolpakov, H. Kbashi, S. V. Sergeyev. Dynamics of vector rogue waves in a fiber laser with a ring cavity. Optica, 3, 870-875(2016).


