• Chinese Optics Letters
  • Vol. 22, Issue 3, 031901 (2024)
Zhaofeng Liu1, Siwei Tang1, Zengrun Wen1、*, Yuanmei Gao1, Yangjian Cai1、2、**, and Liren Zheng1、***
Author Affiliations
  • 1Shandong Provincial Engineering and Technical Center of Light Manipulations & Shandong Provincial Key Laboratory of Optics and Photonic Device, School of Physics and Electronics, Shandong Normal University, Jinan 250358, China
  • 2School of Physical Science and Technology, Soochow University, Suzhou 215006, China
  • show less
    DOI: 10.3788/COL202422.031901 Cite this Article Set citation alerts
    Zhaofeng Liu, Siwei Tang, Zengrun Wen, Yuanmei Gao, Yangjian Cai, Liren Zheng. Talbot effect in anti-PT symmetric synthetic photonic lattices[J]. Chinese Optics Letters, 2024, 22(3): 031901 Copy Citation Text show less
    Schematic of anti-PT symmetric synthetic photonic lattice. (a) Two coupling fiber loops with a length difference and (b) corresponding temporal mesh lattice with anti-PT symmetry. (c) Distribution of the phase, gain, and loss.
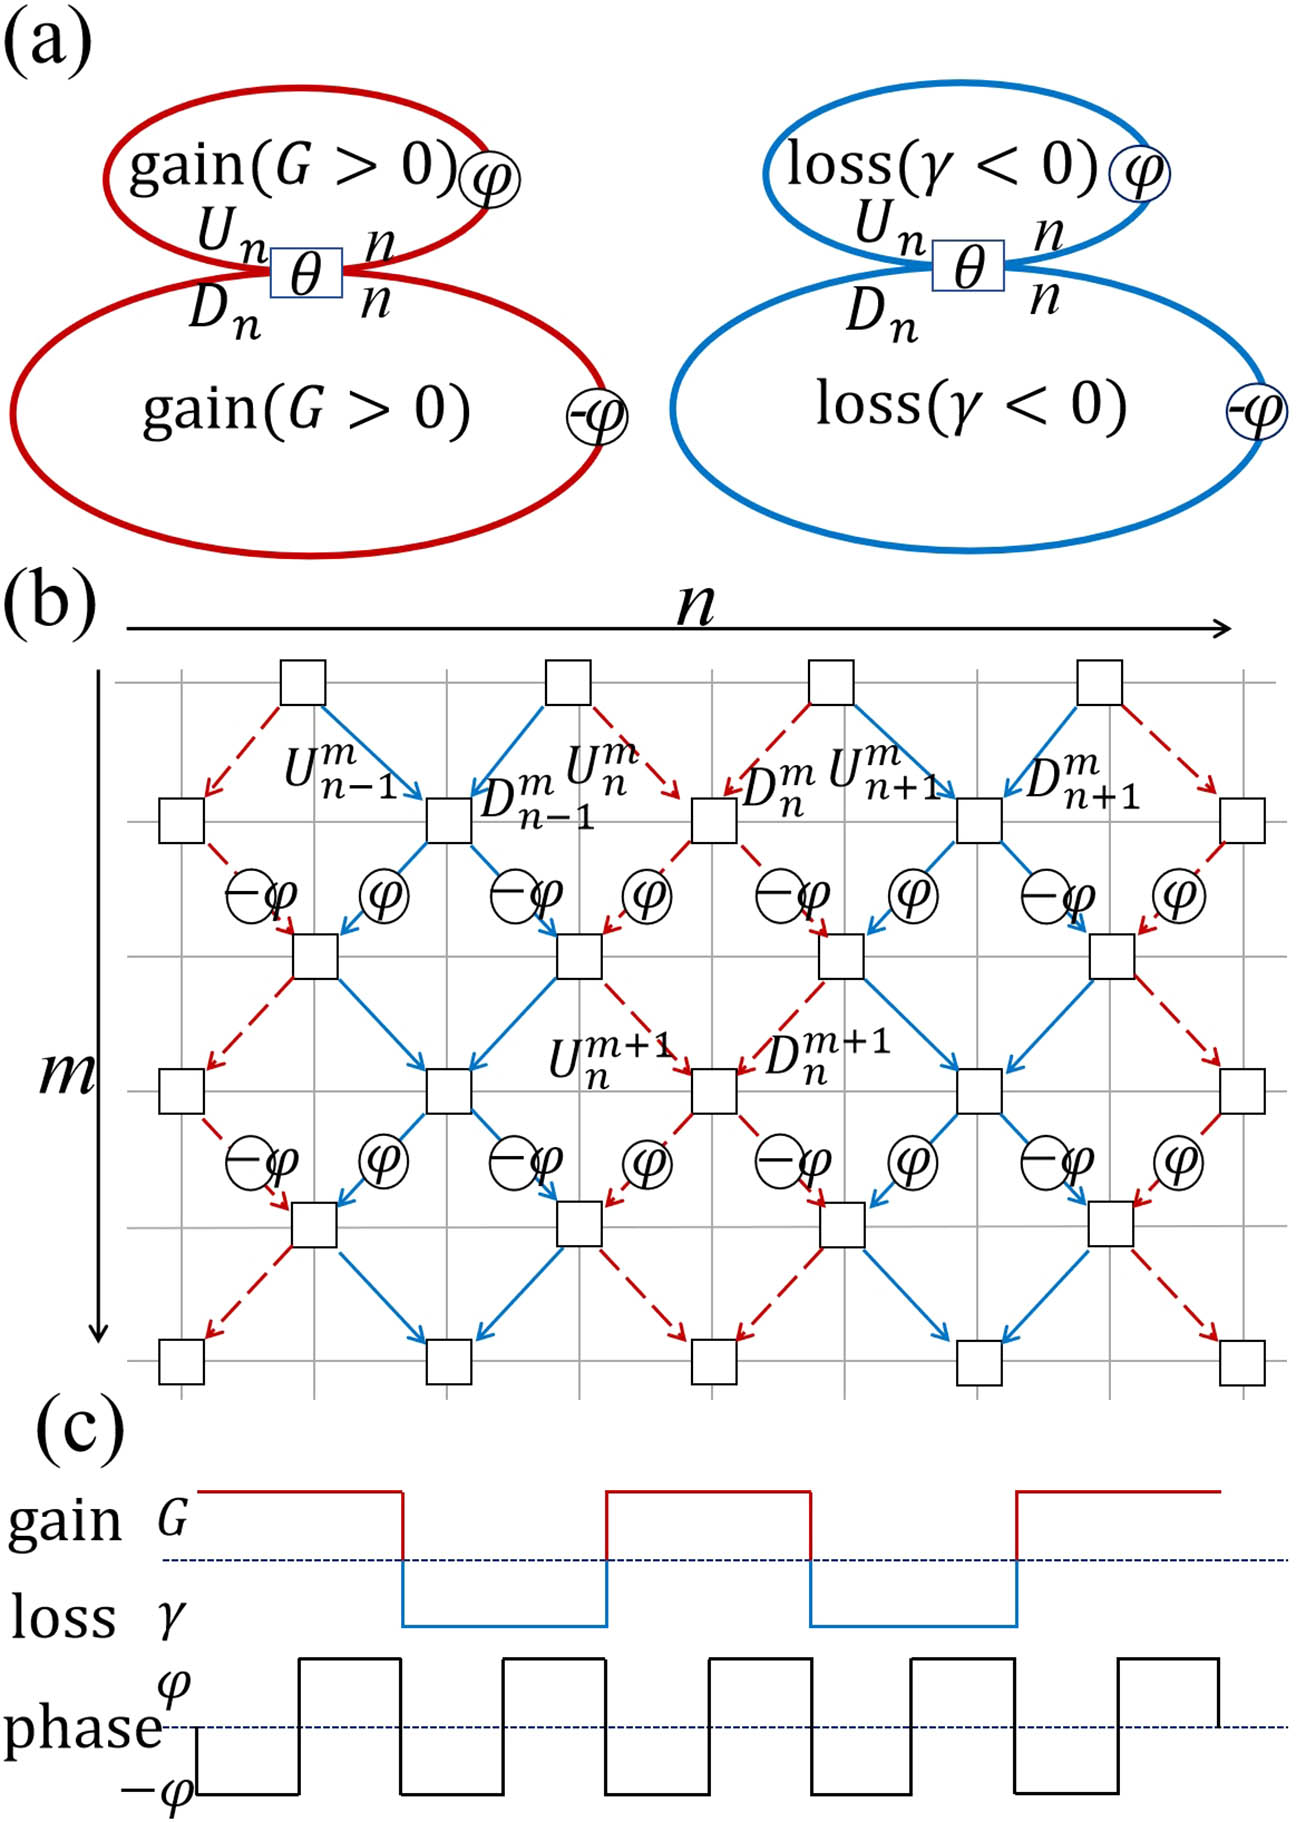
    Fig. 1. Schematic of anti-PT symmetric synthetic photonic lattice. (a) Two coupling fiber loops with a length difference and (b) corresponding temporal mesh lattice with anti-PT symmetry. (c) Distribution of the phase, gain, and loss.
    Band structures for G = 0, G = 0.1, G = 0.2, G = 0.3, G = 0.327, and G = 0.33, respectively. φ = π/2. The blue line represents the real part of the band, and the red line represents the imaginary part of the band.
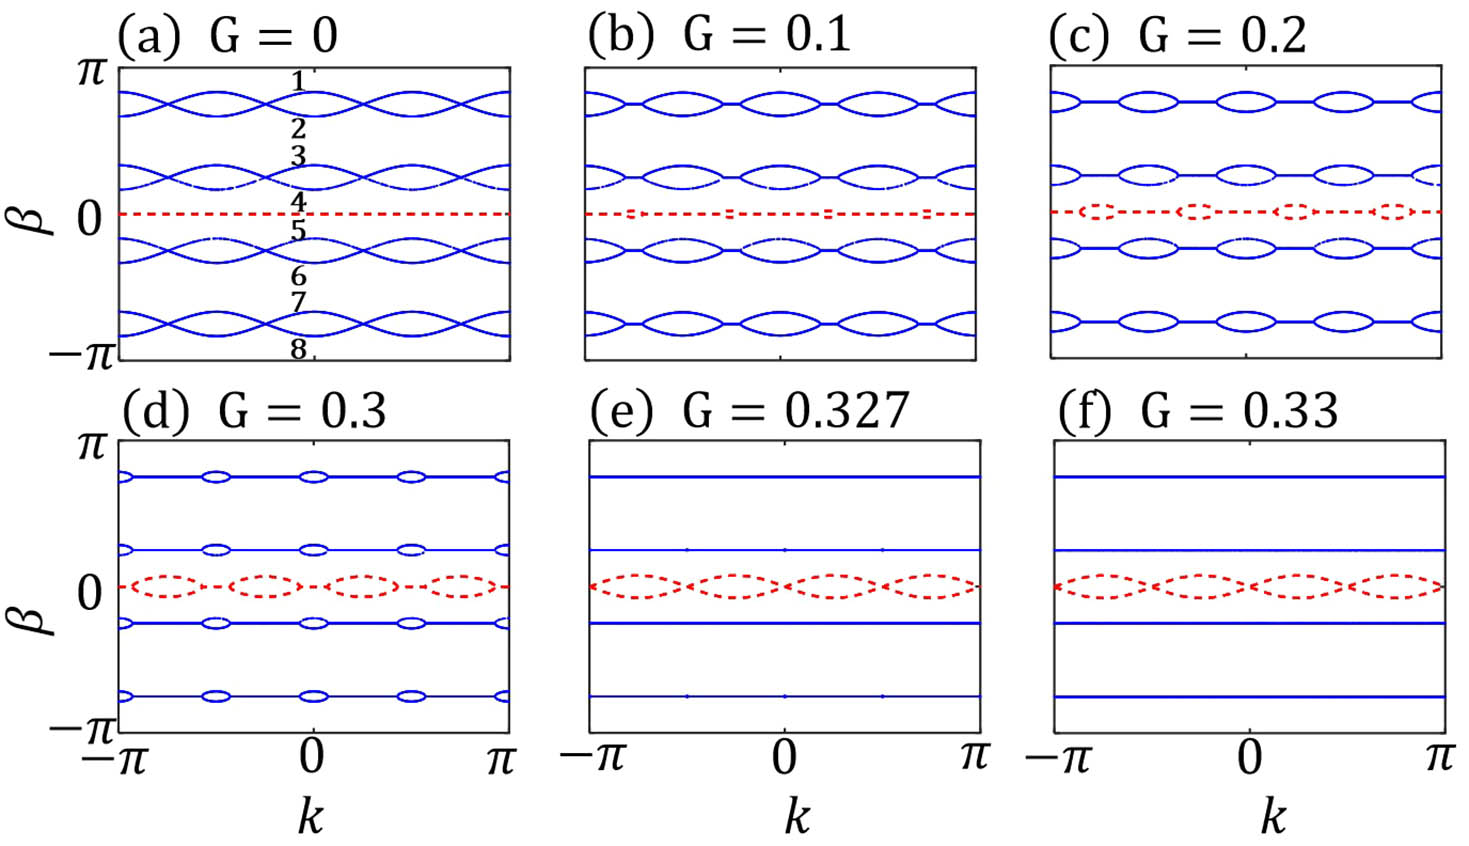
    Fig. 2. Band structures for G = 0, G = 0.1, G = 0.2, G = 0.3, G = 0.327, and G = 0.33, respectively. φ = π/2. The blue line represents the real part of the band, and the red line represents the imaginary part of the band.
    (a1), (b1) The pulse intensity evolution in the long loop is shown for φ = 0 and φ = 0.5π, respectively. The input period is N = 4. (c1), (d1) The pulse intensity evolution in the long loop is shown for N = 8 and N = 12 with φ = 0. The green dotted line is the location of the Talbot images.
    Fig. 3. (a1), (b1) The pulse intensity evolution in the long loop is shown for φ = 0 and φ = 0.5π, respectively. The input period is N = 4. (c1), (d1) The pulse intensity evolution in the long loop is shown for N = 8 and N = 12 with φ = 0. The green dotted line is the location of the Talbot images.
    Input pulse period N = 4. (a1), (b1) Talbot carpets for φ0 = 0.36π and φ0 = 0.46π. G = 0. (c1), (d1) Talbot carpets for φ0 = 0.15π and φ0 = 0.5π. G = 0.21.
    Fig. 4. Input pulse period N = 4. (a1), (b1) Talbot carpets for φ0 = 0.36π and φ0 = 0.46π. G = 0. (c1), (d1) Talbot carpets for φ0 = 0.15π and φ0 = 0.5π. G = 0.21.
    (a1), (b1) Talbot carpets for G = 0.29 and G = 0.35. φ = 0. (c1), (d1) Talbot carpets for G = 0.25 and G = 0.31. φ = π/2. (e1), (f1) Talbot carpets for G = 0.29 and G = 0.35. φ = π.
    Fig. 5. (a1), (b1) Talbot carpets for G = 0.29 and G = 0.35. φ = 0. (c1), (d1) Talbot carpets for G = 0.25 and G = 0.31. φ = π/2. (e1), (f1) Talbot carpets for G = 0.29 and G = 0.35. φ = π.
    The curve representing the anti-PT symmetry breaking threshold in a two-dimensional parameter space of φ and γ.
    Fig. 6. The curve representing the anti-PT symmetry breaking threshold in a two-dimensional parameter space of φ and γ.
    Zhaofeng Liu, Siwei Tang, Zengrun Wen, Yuanmei Gao, Yangjian Cai, Liren Zheng. Talbot effect in anti-PT symmetric synthetic photonic lattices[J]. Chinese Optics Letters, 2024, 22(3): 031901
    Download Citation