• Photonics Research
  • Vol. 12, Issue 4, 821 (2024)
Wei Shi, Yingchuan He, Jianlin Wang, Lulu Zhou, Jianwei Chen, Liwei Zhou, Zeyu Xi, Zhen Wang, Ke Fang, and Yiming Li*
Author Affiliations
  • Department of Biomedical Engineering, Southern University of Science and Technology, Shenzhen 518055, China
  • show less
    DOI: 10.1364/PRJ.514414 Cite this Article Set citation alerts
    Wei Shi, Yingchuan He, Jianlin Wang, Lulu Zhou, Jianwei Chen, Liwei Zhou, Zeyu Xi, Zhen Wang, Ke Fang, Yiming Li. Aberration correction for deformable-mirror-based remote focusing enables high-accuracy whole-cell super-resolution imaging[J]. Photonics Research, 2024, 12(4): 821 Copy Citation Text show less
    Schematic diagram illustrating the remote focusing principle. (a) Simplified schematic of a microscope configured for remote focusing using a DM in the imaging path. (b) The DM modulates the wavefront by controlling its defocus phase to shift different refocused focal planes around the nominal focal plane along the optical z-axis. (c) The defocus phase root mean square error (RMSE) for the optical wavefront is indicated when remotely focusing to different axial positions within the imaging optical system.
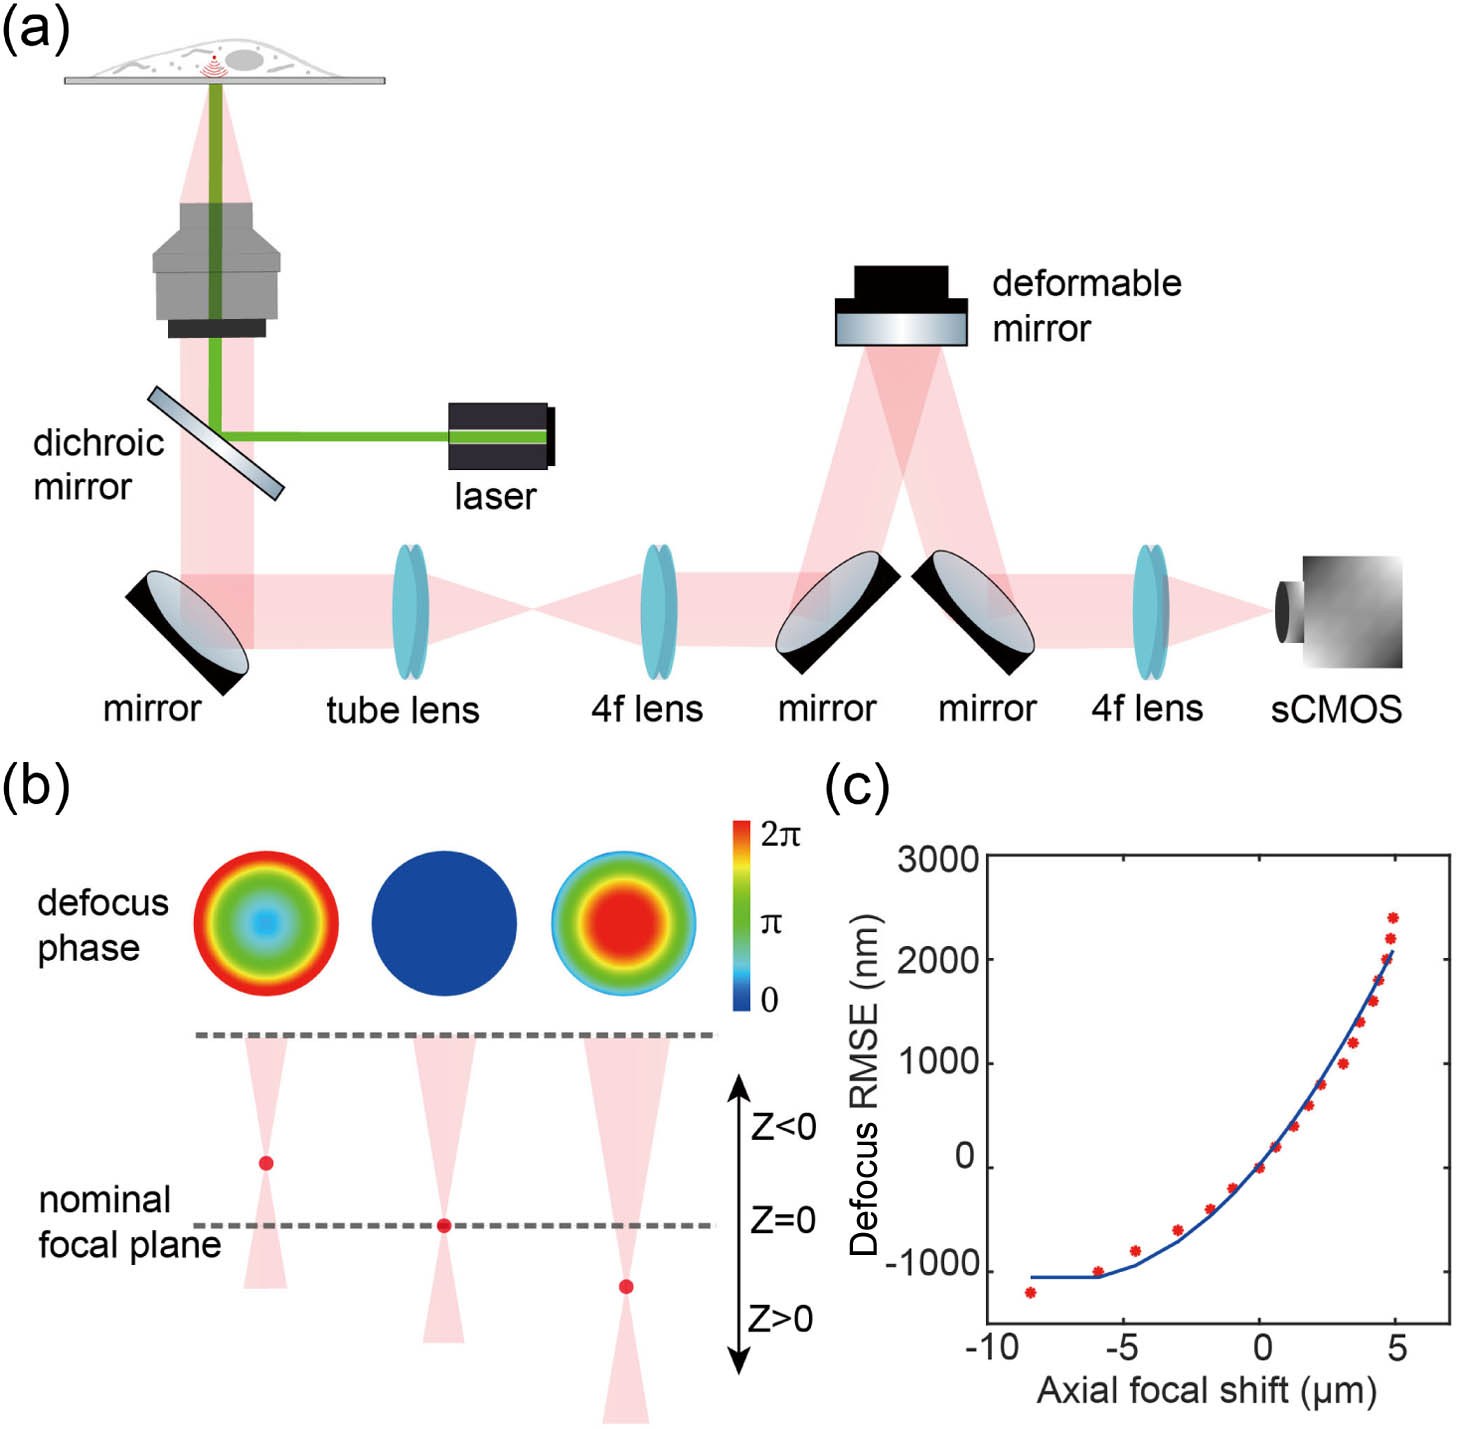
    Fig. 1. Schematic diagram illustrating the remote focusing principle. (a) Simplified schematic of a microscope configured for remote focusing using a DM in the imaging path. (b) The DM modulates the wavefront by controlling its defocus phase to shift different refocused focal planes around the nominal focal plane along the optical z-axis. (c) The defocus phase root mean square error (RMSE) for the optical wavefront is indicated when remotely focusing to different axial positions within the imaging optical system.
    Comparison of the localization precision between experimental astigmatism PSF and DMO PSF. (a) Averaged astigmatism PSF of fluorescent beads on the coverslip, with PSFs at axial positions from −800 to 800 nm. (b) The pupil function corresponding to the astigmatism PSF of beads. (c) Averaged DMO PSF of fluorescent beads, identical to the range described in (a). (d) Same as (b) for DMO PSF. (e) x, y, and z localization precisions at different axial positions for astigmatism PSF. For the CRLB calculation, we used 3000 photons and 30 background photons to simulate the typical photon flux of fluorescent dyes. (f) 3D CRLB of astigmatism PSF. (g) x, y, and z localization precisions for DMO PSF. (h) 3D CRLB of DMO PSF.
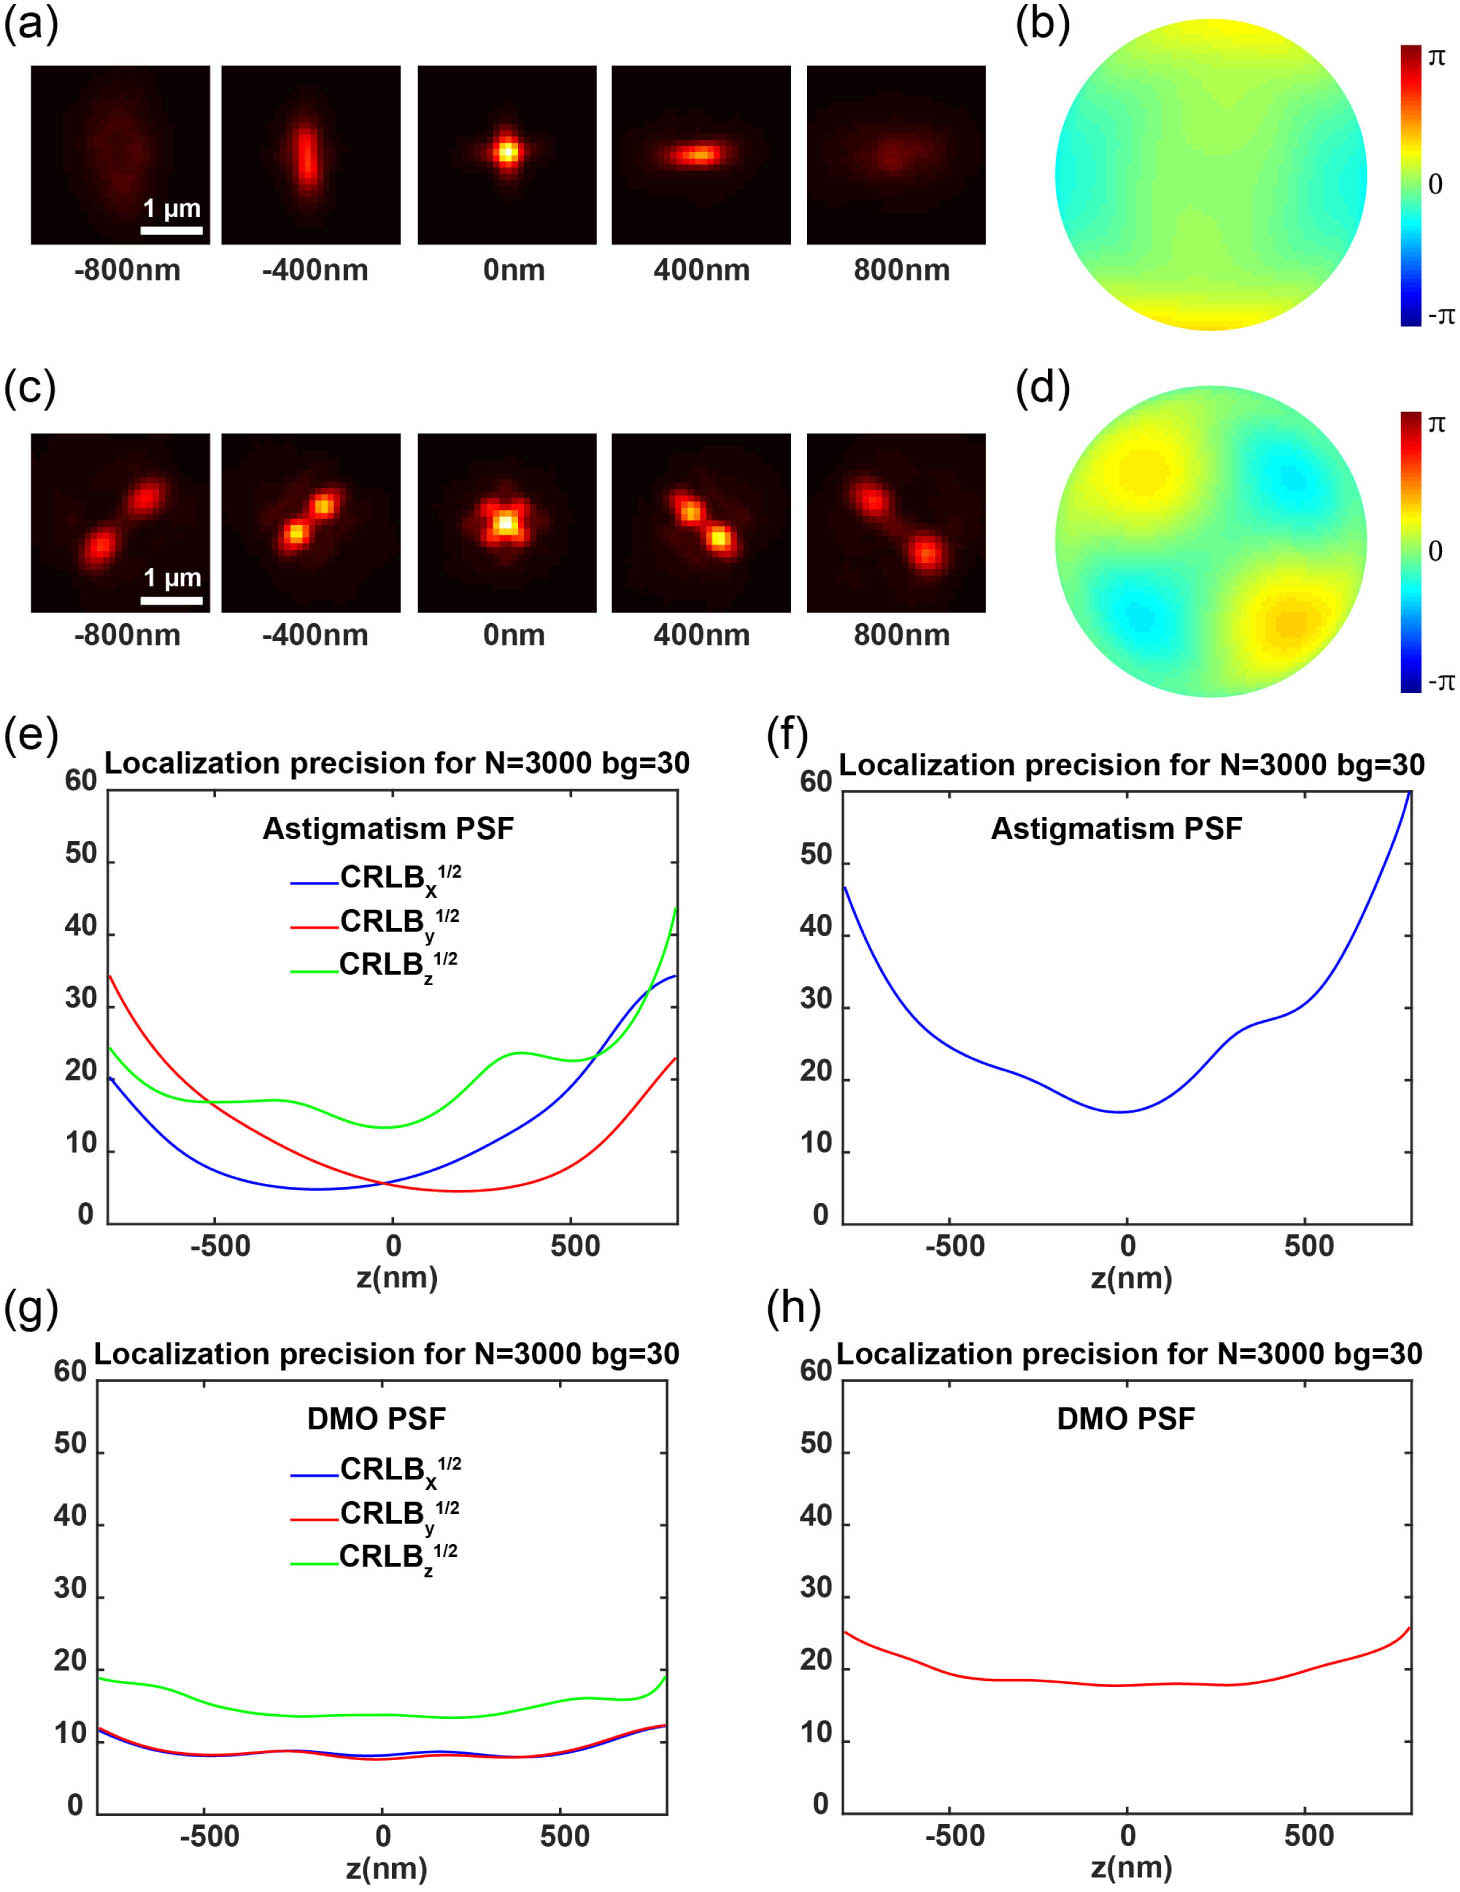
    Fig. 2. Comparison of the localization precision between experimental astigmatism PSF and DMO PSF. (a) Averaged astigmatism PSF of fluorescent beads on the coverslip, with PSFs at axial positions from 800 to 800 nm. (b) The pupil function corresponding to the astigmatism PSF of beads. (c) Averaged DMO PSF of fluorescent beads, identical to the range described in (a). (d) Same as (b) for DMO PSF. (e) x, y, and z localization precisions at different axial positions for astigmatism PSF. For the CRLB calculation, we used 3000 photons and 30 background photons to simulate the typical photon flux of fluorescent dyes. (f) 3D CRLB of astigmatism PSF. (g) x, y, and z localization precisions for DMO PSF. (h) 3D CRLB of DMO PSF.
    Correcting aberrations during refocusing with DMO PSF using a DM at various axial positions of the beads on the coverslip. (a) The beads were refocused using a DM to a position 2 μm above the nominal focal plane. (b) The pupil function for the refocused beads. (c) Fitted 21 Zernike coefficients for the beads stack. (d) CRLB for the experimental DMO PSF, calculated using 3000 photons and 30 background photons to simulate the typical photon flux of fluorescent dyes. A comparison of CRLB calculations based on the typical photon flux of fluorescent proteins is shown in Fig. 9 of Appendix C. (e)–(h) The PSF shape, pupil function, Zernike coefficients, and localization precision after aberration correction, respectively. The CRLB exhibits significant improvements, particularly in the z localization precision.
    Fig. 3. Correcting aberrations during refocusing with DMO PSF using a DM at various axial positions of the beads on the coverslip. (a) The beads were refocused using a DM to a position 2 μm above the nominal focal plane. (b) The pupil function for the refocused beads. (c) Fitted 21 Zernike coefficients for the beads stack. (d) CRLB for the experimental DMO PSF, calculated using 3000 photons and 30 background photons to simulate the typical photon flux of fluorescent dyes. A comparison of CRLB calculations based on the typical photon flux of fluorescent proteins is shown in Fig. 9 of Appendix C. (e)–(h) The PSF shape, pupil function, Zernike coefficients, and localization precision after aberration correction, respectively. The CRLB exhibits significant improvements, particularly in the z localization precision.
    Whole-cell 3D super-resolution imaging of NPC. (a) Overview of the panoramic whole-cell 3D imaging of NPC using DMO PSF, merging five optical sections. (b) FRC analysis of the region boxed in (a). (c) Side-view cross section of the region denoted by the dashed line in (a). (d), (e) Magnified view of the area denoted by the box in (c). (f) View of the bottom surface of the boxed area in (a). (g) View of the top surface of the boxed area in (a). (h), (i) Intensity profile along the white dashed lines in (f) and (g). (j), (k) Intensity profile along the white dashed lines in (d) and (e). The data were acquired from 8000 frames per cycle over 20 cycles from five optical sections, with 120 mW laser power and 20 ms exposure time.
    Fig. 4. Whole-cell 3D super-resolution imaging of NPC. (a) Overview of the panoramic whole-cell 3D imaging of NPC using DMO PSF, merging five optical sections. (b) FRC analysis of the region boxed in (a). (c) Side-view cross section of the region denoted by the dashed line in (a). (d), (e) Magnified view of the area denoted by the box in (c). (f) View of the bottom surface of the boxed area in (a). (g) View of the top surface of the boxed area in (a). (h), (i) Intensity profile along the white dashed lines in (f) and (g). (j), (k) Intensity profile along the white dashed lines in (d) and (e). The data were acquired from 8000 frames per cycle over 20 cycles from five optical sections, with 120 mW laser power and 20 ms exposure time.
    Whole-cell 3D super-resolution imaging of microtubules. (a) Overview of the panoramic whole-cell 3D imaging of microtubule using DMO PSF, merging seven optical sections. (b) Zoomed bottom surface view of the boxed area denoted in (a). (c) Zoomed top surface view of the boxed area denoted in (a). (d) Side-view cross section of the region denoted by the dashed line in (a). The data were acquired from 7000 frames per cycle over 40 cycles from seven optical sections, with 200 mW laser power and 15 ms exposure time.
    Fig. 5. Whole-cell 3D super-resolution imaging of microtubules. (a) Overview of the panoramic whole-cell 3D imaging of microtubule using DMO PSF, merging seven optical sections. (b) Zoomed bottom surface view of the boxed area denoted in (a). (c) Zoomed top surface view of the boxed area denoted in (a). (d) Side-view cross section of the region denoted by the dashed line in (a). The data were acquired from 7000 frames per cycle over 40 cycles from seven optical sections, with 200 mW laser power and 15 ms exposure time.
    In situ aberration correction using blinking single-molecules under remote focusing. (a) The beads on the coverslip were refocused using the DM to 1 μm above the nominal focal plane, with a pre-correction for aberrations applied to the imaging system. (b) Pupil function derived from the PSF of refocused beads. (c) The refocused PSF was obtained from single-molecule blinking data of immunofluorescence-labeled TOM20, recorded at a depth of 2.5 μm in COS-7 cells. (d) Pupil function calculated from the in situ PSF. (e), (f) The PSF shape and its corresponding pupil function after in situ aberration correction. (g) The fitted 21 Zernike coefficients were obtained from the PSF of refocused beads after system aberration correction, the in situ blinking single-molecule, and the in situ PSF after aberration correction using blinking single-molecule.
    Fig. 6. In situ aberration correction using blinking single-molecules under remote focusing. (a) The beads on the coverslip were refocused using the DM to 1 μm above the nominal focal plane, with a pre-correction for aberrations applied to the imaging system. (b) Pupil function derived from the PSF of refocused beads. (c) The refocused PSF was obtained from single-molecule blinking data of immunofluorescence-labeled TOM20, recorded at a depth of 2.5 μm in COS-7 cells. (d) Pupil function calculated from the in situ PSF. (e), (f) The PSF shape and its corresponding pupil function after in situ aberration correction. (g) The fitted 21 Zernike coefficients were obtained from the PSF of refocused beads after system aberration correction, the in situ blinking single-molecule, and the in situ PSF after aberration correction using blinking single-molecule.
    Whole-cell 3D super-resolution imaging of mitochondria. (a) Overview of the panoramic whole-cell 3D imaging of mitochondria using DMO PSF by merging three optical sections. (b) Side-view cross section of the region indicated by the dashed line in (a). (c)–(e) Zoomed-in side-view cross sections from distinct depth areas, as indicated by the dashed lines in (a). (f), (g) FRC analysis of regions enclosed by the boxes in (a), with (f) near the cell’s bottom surface and (g) near the top. The data were acquired from 3000 frames per cycle over 70 cycles from three optical sections, with 200 mW laser power and 15 ms exposure time.
    Fig. 7. Whole-cell 3D super-resolution imaging of mitochondria. (a) Overview of the panoramic whole-cell 3D imaging of mitochondria using DMO PSF by merging three optical sections. (b) Side-view cross section of the region indicated by the dashed line in (a). (c)–(e) Zoomed-in side-view cross sections from distinct depth areas, as indicated by the dashed lines in (a). (f), (g) FRC analysis of regions enclosed by the boxes in (a), with (f) near the cell’s bottom surface and (g) near the top. The data were acquired from 3000 frames per cycle over 70 cycles from three optical sections, with 200 mW laser power and 15 ms exposure time.
    Detailed layout of the optical setup. M, mirror; DM, dichroic mirror; L, lens; TS, translation stage; FC, fiber coupler; Fiber, single-mode fiber; BFP, back focal plane; FW, filter-wheel; TBL, tube lens; AP, aperture; QPD, quadrant photodiode. The excitation lasers are first reflected by dichroic mirror DM1 and then coupled into a single-mode fiber through the fiber coupler FC. Before being reflected by the main dichroic mirror DM2 to enter the objective for sample illumination, a pair of lenses L1 and L2 along with a slit at AP1 are used for collimating and reshaping the beam. In the imaging path, the fluorescence collected by the objective is transmitted through the dichroic mirror DM2 and filtered by the filters on the filter wheel FW. It is then imaged onto the aperture AP2, which is confined by a slit, using a tube lens TBL. Subsequently, the fluorescence passes through a 4f system composed of lenses L3 and L4, with a deformable mirror installed in the Fourier plane, and ultimately, the fluorescence signal is detected by the camera. Additionally, a beam excited by a 785 nm laser, reflected off the coverslip, is detected by the quadrant photodiode QPD, which provides feedback control to the z-stage for focus locking.
    Fig. 8. Detailed layout of the optical setup. M, mirror; DM, dichroic mirror; L, lens; TS, translation stage; FC, fiber coupler; Fiber, single-mode fiber; BFP, back focal plane; FW, filter-wheel; TBL, tube lens; AP, aperture; QPD, quadrant photodiode. The excitation lasers are first reflected by dichroic mirror DM1 and then coupled into a single-mode fiber through the fiber coupler FC. Before being reflected by the main dichroic mirror DM2 to enter the objective for sample illumination, a pair of lenses L1 and L2 along with a slit at AP1 are used for collimating and reshaping the beam. In the imaging path, the fluorescence collected by the objective is transmitted through the dichroic mirror DM2 and filtered by the filters on the filter wheel FW. It is then imaged onto the aperture AP2, which is confined by a slit, using a tube lens TBL. Subsequently, the fluorescence passes through a 4f system composed of lenses L3 and L4, with a deformable mirror installed in the Fourier plane, and ultimately, the fluorescence signal is detected by the camera. Additionally, a beam excited by a 785 nm laser, reflected off the coverslip, is detected by the quadrant photodiode QPD, which provides feedback control to the z-stage for focus locking.
    CRLB calculations before and after aberration correction of the beads on the coverslip during refocusing with DMO PSF using a DM. (a) The CRLB for the experimental DMO PSF was calculated using 800 photons and 10 background photons, simulating the typical photon flux of fluorescent proteins. (b) Localization precision after aberration correction. The CRLB showed significant improvements, particularly in the z localization precision.
    Fig. 9. CRLB calculations before and after aberration correction of the beads on the coverslip during refocusing with DMO PSF using a DM. (a) The CRLB for the experimental DMO PSF was calculated using 800 photons and 10 background photons, simulating the typical photon flux of fluorescent proteins. (b) Localization precision after aberration correction. The CRLB showed significant improvements, particularly in the z localization precision.
    Comparison of raw single-molecule images before and after aberration correction, accompanied by the distribution of photons and background photons. (a) Snapshots of an unmodified 2D single-molecule image of Nup96-SNAP-AF647 labeled NPCs in U2OS cell samples refocused to 4 μm above the nominal focal plane. The inset shows a zoomed view of the fluorophore in the boxed area. (b) Snapshots of the 2D single-molecule image after aberration correction, with a significantly improved SNR in the image. The inset clearly shows the successful recovery of the distorted PSF. (c) The photon distribution analysis from 2000 frames of 2D single-molecule images before and after aberration correction reveals that 1644 single-molecule events with an average photon count of 335 were localized before correction, whereas 9680 single-molecule events with an average photon count of 711 were localized after correction. (d) The background photon distribution analysis from the same 2000 frames of 2D single-molecule images before and after aberration correction showed an average background photon count of 29 before correction and an average photon count of 25 after correction. The single-molecule raw images were acquired at 120 mW laser power and 20 ms exposure time.
    Fig. 10. Comparison of raw single-molecule images before and after aberration correction, accompanied by the distribution of photons and background photons. (a) Snapshots of an unmodified 2D single-molecule image of Nup96-SNAP-AF647 labeled NPCs in U2OS cell samples refocused to 4 μm above the nominal focal plane. The inset shows a zoomed view of the fluorophore in the boxed area. (b) Snapshots of the 2D single-molecule image after aberration correction, with a significantly improved SNR in the image. The inset clearly shows the successful recovery of the distorted PSF. (c) The photon distribution analysis from 2000 frames of 2D single-molecule images before and after aberration correction reveals that 1644 single-molecule events with an average photon count of 335 were localized before correction, whereas 9680 single-molecule events with an average photon count of 711 were localized after correction. (d) The background photon distribution analysis from the same 2000 frames of 2D single-molecule images before and after aberration correction showed an average background photon count of 29 before correction and an average photon count of 25 after correction. The single-molecule raw images were acquired at 120 mW laser power and 20 ms exposure time.
    Correcting aberrations during refocusing with astigmatism PSF using a DM at various axial positions of the beads on the coverslip. (a) The beads are refocused using a DM to a position 2 μm above the nominal focal plane. (b) The pupil function for the refocused beads. (c) Fitted 21 Zernike coefficients for the beads stack. (d) CRLB for the experimental astigmatism PSF, with 3000 photons and 30 background photons used in the CRLB calculation. (e)–(h) The PSF shape, pupil function, Zernike coefficients, and localization precision after aberration correction, respectively. The CRLB exhibits significant improvements, particularly in the Z-axis localization precision.
    Fig. 11. Correcting aberrations during refocusing with astigmatism PSF using a DM at various axial positions of the beads on the coverslip. (a) The beads are refocused using a DM to a position 2 μm above the nominal focal plane. (b) The pupil function for the refocused beads. (c) Fitted 21 Zernike coefficients for the beads stack. (d) CRLB for the experimental astigmatism PSF, with 3000 photons and 30 background photons used in the CRLB calculation. (e)–(h) The PSF shape, pupil function, Zernike coefficients, and localization precision after aberration correction, respectively. The CRLB exhibits significant improvements, particularly in the Z-axis localization precision.
    Experimental astigmatic 3D data of NPCs before and after aberration correction by refocusing. (a) Overview of 3D super-resolution image of Nup96-SNAP-AF647, refocused using a DM at 2 μm above the nominal focal plane. Reconstructed using the Cspline experimental PSF model shown in Fig. 11(a). (b) Magnified view of the area denoted by the box in (a). (c) Side-view cross section of the region denoted by the dashed line in (a). (d)–(f) 3D super-resolution image of NPCs after aberration correction at the refocused position. Significant improvements were observed in the reconstructed images, particularly in the XZ plane, where the double ring structure of NPCs became distinctly visible after aberration correction, as indicated by the white arrows in panels (c) and (f). The data were acquired from 50,000 frames with 120 mW laser power and 20 ms exposure time.
    Fig. 12. Experimental astigmatic 3D data of NPCs before and after aberration correction by refocusing. (a) Overview of 3D super-resolution image of Nup96-SNAP-AF647, refocused using a DM at 2 μm above the nominal focal plane. Reconstructed using the Cspline experimental PSF model shown in Fig. 11(a). (b) Magnified view of the area denoted by the box in (a). (c) Side-view cross section of the region denoted by the dashed line in (a). (d)–(f) 3D super-resolution image of NPCs after aberration correction at the refocused position. Significant improvements were observed in the reconstructed images, particularly in the XZ plane, where the double ring structure of NPCs became distinctly visible after aberration correction, as indicated by the white arrows in panels (c) and (f). The data were acquired from 50,000 frames with 120 mW laser power and 20 ms exposure time.
    Optimization of tetrapod PSF using a DM for the beads on the coverslip. (a) The averaged tetrapod PSF for fluorescent beads on the coverslip, with PSFs at axial positions from −2500 to 2500 nm. (b) The pupil function for the beads. (c) Fitted 21 Zernike coefficients for the beads stack. (d) CRLB for the experimental tetrapod PSF, with 3000 photons and 30 background photons used in the CRLB calculation.
    Fig. 13. Optimization of tetrapod PSF using a DM for the beads on the coverslip. (a) The averaged tetrapod PSF for fluorescent beads on the coverslip, with PSFs at axial positions from 2500 to 2500 nm. (b) The pupil function for the beads. (c) Fitted 21 Zernike coefficients for the beads stack. (d) CRLB for the experimental tetrapod PSF, with 3000 photons and 30 background photons used in the CRLB calculation.
    Whole-cell 3D super-resolution imaging of NPC using DMO tetrapod PSF. (a) Overview of the panoramic whole-cell 3D imaging of NPC using DMO tetrapod PSF without remote focusing. (b) FRC analysis of the regions indicated in (a). (c) Side-view cross section of the region denoted by the dashed line in (a). (d) Magnified view of the area denoted by the box in (a). (e) View of the bottom surface of the area in (d). (f) View of the top surface of the area in (d). The data were acquired from 100,000 frames with 120 mW laser power and 20 ms exposure time.
    Fig. 14. Whole-cell 3D super-resolution imaging of NPC using DMO tetrapod PSF. (a) Overview of the panoramic whole-cell 3D imaging of NPC using DMO tetrapod PSF without remote focusing. (b) FRC analysis of the regions indicated in (a). (c) Side-view cross section of the region denoted by the dashed line in (a). (d) Magnified view of the area denoted by the box in (a). (e) View of the bottom surface of the area in (d). (f) View of the top surface of the area in (d). The data were acquired from 100,000 frames with 120 mW laser power and 20 ms exposure time.
    Comparison of in situ aberration pre-correction and actual aberration correction differences in various cells using single-molecule blinking data. (a) Pre-correction PSF derived from single-molecule blinking data of immunofluorescence-labeled TOM20 in COS7 cells at a depth of 2.5 μm. (b) Pupil function calculated from the in situ PSF of pre-correction. (c), (d) The PSF shape and its corresponding pupil function after in situ aberration correction. (e) The fitted 21 Zernike coefficients obtained from the in-situ single-molecule blinking data of pre-corrected cells, contrasting the differences between pre-corrected and actual corrected cells.
    Fig. 15. Comparison of in situ aberration pre-correction and actual aberration correction differences in various cells using single-molecule blinking data. (a) Pre-correction PSF derived from single-molecule blinking data of immunofluorescence-labeled TOM20 in COS7 cells at a depth of 2.5 μm. (b) Pupil function calculated from the in situ PSF of pre-correction. (c), (d) The PSF shape and its corresponding pupil function after in situ aberration correction. (e) The fitted 21 Zernike coefficients obtained from the in-situ single-molecule blinking data of pre-corrected cells, contrasting the differences between pre-corrected and actual corrected cells.
    Wei Shi, Yingchuan He, Jianlin Wang, Lulu Zhou, Jianwei Chen, Liwei Zhou, Zeyu Xi, Zhen Wang, Ke Fang, Yiming Li. Aberration correction for deformable-mirror-based remote focusing enables high-accuracy whole-cell super-resolution imaging[J]. Photonics Research, 2024, 12(4): 821
    Download Citation