• Chinese Optics Letters
  • Vol. 16, Issue 1, 010603 (2018)
Fenghou Xie1、2, Chongyun Shao1、2, Fengguang Lou1, Meng Wang1, Chunlei Yu1、*, Suya Feng1、3, and Lili Hu1
Author Affiliations
  • 1Shanghai Institute of Optics and Fine Mechanics, Chinese Academy of Sciences, Shanghai 201800, China
  • 2University of Chinese Academy of Sciences, Beijing 100049, China
  • 3e-mail: fsy@siom.ac.cn
  • show less
    DOI: 10.3788/COL201816.010603 Cite this Article Set citation alerts
    Fenghou Xie, Chongyun Shao, Fengguang Lou, Meng Wang, Chunlei Yu, Suya Feng, Lili Hu. Effect of power scale of 974 and 633 nm lasers on the induced loss at 633 nm of Yb3+/Al3+ co-doped silica fiber[J]. Chinese Optics Letters, 2018, 16(1): 010603 Copy Citation Text show less
    Schematic configuration of the PD measurement.
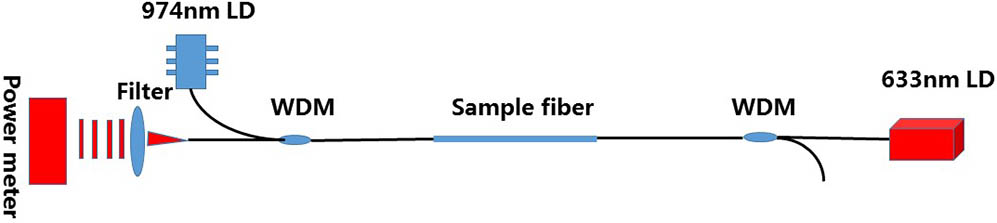
    Fig. 1. Schematic configuration of the PD measurement.
    (Color online) Average inversion and standard deviation of the inversion versus pump power for a core-pumped Yb3+/Al3+ co-doped silica fiber.
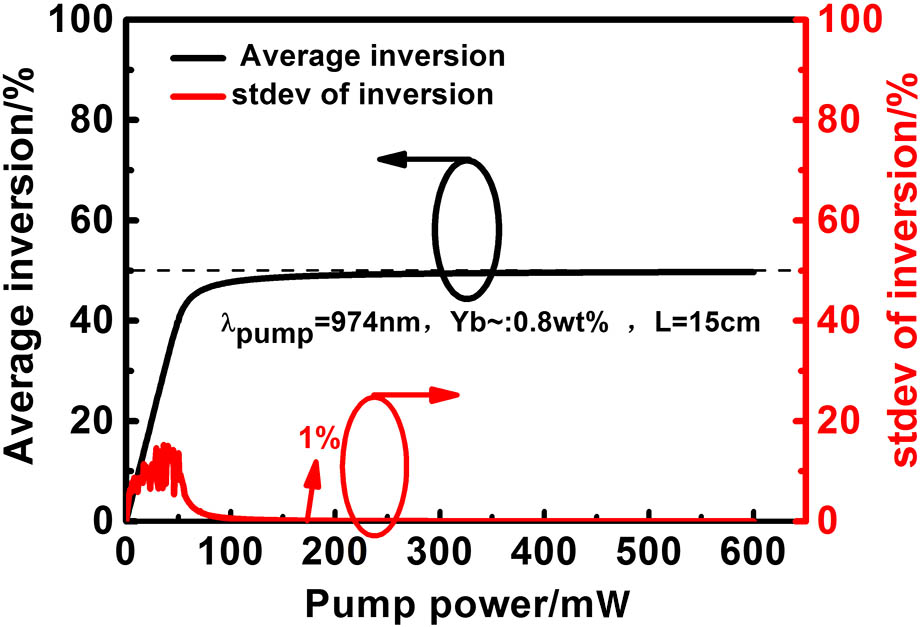
    Fig. 2. (Color online) Average inversion and standard deviation of the inversion versus pump power for a core-pumped Yb3+/Al3+ co-doped silica fiber.
    (Color online) Dynamic equilibrium of PD and PB. PD>PB means PD is stronger than PB: (a) the powers at 633 nm are 0.01 and 1.7 mW; A–G indicate the experimental process, (b) the power at 633 nm is 1.7 mW.
    Fig. 3. (Color online) Dynamic equilibrium of PD and PB. PD>PB means PD is stronger than PB: (a) the powers at 633 nm are 0.01 and 1.7 mW; A–G indicate the experimental process, (b) the power at 633 nm is 1.7 mW.
    (Color online) Induced loss at 633 nm: (a) with different 974 nm pump powers, (b) PB with different wavelengths.
    Fig. 4. (Color online) Induced loss at 633 nm: (a) with different 974 nm pump powers, (b) PB with different wavelengths.
    (Color online) Induced loss at 633 nm with different powers at 633 nm, the power at 974 nm is 250 mW.
    Fig. 5. (Color online) Induced loss at 633 nm with different powers at 633 nm, the power at 974 nm is 250 mW.
    (Color online) Relation between 633 nm laser power and saturated loss, time constant. Insert: a linear fit of the saturated loss.
    Fig. 6. (Color online) Relation between 633 nm laser power and saturated loss, time constant. Insert: a linear fit of the saturated loss.
    2D-HYSCORE spectrum of the Yb3+/Al3+ co-doped silica fiber preform.
    Fig. 7. 2D-HYSCORE spectrum of the Yb3+/Al3+ co-doped silica fiber preform.
    Power of 633 nm laser (mW)αeq (dB/m)τ (min)β
    0.012075100.45
    0.621823590.44
    0.991672990.44
    1.71482190.45
    7.31061220.45
    Table 1. Fitting Parameters at Different 633 nm Laser Powers
    Fenghou Xie, Chongyun Shao, Fengguang Lou, Meng Wang, Chunlei Yu, Suya Feng, Lili Hu. Effect of power scale of 974 and 633 nm lasers on the induced loss at 633 nm of Yb3+/Al3+ co-doped silica fiber[J]. Chinese Optics Letters, 2018, 16(1): 010603
    Download Citation