Fenghou Xie, Chongyun Shao, Fengguang Lou, Meng Wang, Chunlei Yu, Suya Feng, Lili Hu, "Effect of power scale of 974 and 633 nm lasers on the induced loss at 633 nm of Yb3+/Al3+ co-doped silica fiber," Chin. Opt. Lett. 16, 010603 (2018)
Copy Citation Text
Induced loss at 633 nm is tested in co-doped silica fiber by a core pumped with a 974 nm laser and probed with a 633 nm laser. The fiber is prepared by the modified chemical vapor deposition method combined with solution doping. Different power scales of pump light and probe light are used in the tests. It is found that there is a dynamic equilibrium between photobleaching induced by 633 nm probe light and photodarkening (PD) induced by 974 nm pump light. For the first time to our knowledge, the effect of 633 nm probe laser power on an induced loss test of co-doped silica fiber is studied quantitatively. It suggests that as long as the 633 nm probe light power is less than 0.2 mW, the induced loss is mainly contributed by the PD effect of pumping light, and the deviation of induced loss is less than 5%.
Yb-doped fiber lasers operating at the 1.0–1.1 μm wavelength region are interesting for scientific and industrial applications[1–3]. However, photodarkening (PD)[4] defined as the increased fiber attenuation induced by pump radiation is known to be a limiting factor for the lifetime and modal instability of high-power fiber[5]. While extensive efforts have been made by different research groups to investigate the physical mechanisms related to PD, the mechanism behind PD remains a debate.
It is proved that PD depends on the density of inversion of the ions[6,7], and the results of PD test are affected by many factors[8], such as fiber length, pump wavelength, pump power, and pump time. The well-known method of PD characterization proposed by Koponen et al.[4,9] is to evaluate the core excess loss by utilizing a 633 nm laser as a probe light. In literature, there are two methods of pump, a cladding pump[10] and a core pump[11]. A cladding pump ensures a uniform cross-sectional inversion, but it requires high pump powers to achieve a relevant power density in the core, which need several pump LD modules to achieve the requirements. In addition, because probe light is usually from a halogen lamp and its power is very low (usually in the pW magnitude), a lock-in amplifier detector is usually used in the PD test in order to improve the signal-to-noise ratio and ensure the accuracy of the tested results, which undoubtedly increases the test system complexity and cost. On the contrary, because of the high absorption in the core pump, a high pump power density and uniform inversion can be achieved by a low pump power (hundreds of mW) in a short length of tested fiber. It can accelerate PD and shorten the test time. In addition, the pump and probe light can be launched into the core and separated easily through a wavelength division multiplexer (WDM), and the 633 nm tunable laser power can reach milliwatts, which improves the signal-to-noise ratio. In addition, a computer-controlled USB-type power meter can be used to record the probe light power automatically according to the programmed sampling interval, which simplifies the test setup and reduces the test cost.
However, the 633 nm laser can bleach the darkened fiber[12,13], leading to the experimental result deviating from authenticity. Furthermore, Jestchke et al.[10,14] reported that the induced loss is bleached partially by the 915 nm pump power itself with a cladding pump. To achieve the accurate PD performance evaluation, the effect of the 633 nm laser on PD must be taken into account. The impact of the fusion quality and the stability of the WDM, probe light source, and pump light source on the PD test[11,15] has been studied, but there is no report about the effect of the 633 nm laser on the PD test. The present work is mainly focused on a discussion of the dynamic effect of the 633 nm laser on PD performance of a -doped silica fiber, and the 633 nm laser can act both as a probe light and a bleaching light. The effect of the 633 nm power scale on the accuracy of the PD test results was analyzed quantitatively.
The co-doped silica fiber is prepared by the modified chemical vapor deposition and solution doping processes. The dopant concentrations of and are 0.8 wt% and 1.56 wt%, the diameter of the core and inner cladding are 10 and 200 μm, the numerical aperture (NA) is 0.08, the length of the PD test fiber is 15 cm.
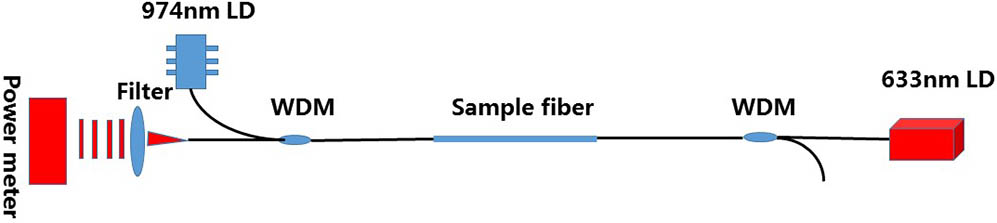
The induced loss of fiber at 633 nm was measured in situ during long-term excitation by a core pumped with 974 nm with the setup illustrated in Fig. 1. The 974 nm pump light provided by the LUMENTUM S27-PBR521 and the 633 nm probe light provided by the Wavespectrum-laser WSLS-633-030 m are launched into the core through the custom 633/974 nm WDM from the opposite direction, respectively. The filter, provided by THORLABS FESH0750, at the end of the fiber, is mainly used to filter out the residual pump light and luminescence to ensure the reliability of the power meter records. The 633 nm laser power was recorded by THORLABS S150 C; the minimum power that can be detected is 100 pW and its resolution is 10 pW, far below the minimum power of 10 μW during the experiment, which ensures the accuracy of the 633 nm laser power measurement. In order to accelerate PD, the inversion calculated from the measured absorption and emission at the pump wavelength and lifetime of the ions is saturated, approximately 50%. In fact, the reproducibility of the ion inversion was found to depend on the reproducibility of the pump wavelength, assuming the pump power is high enough to saturate the inversion of the ions.
Figure 1.Schematic configuration of the PD measurement.
In addition, to avoid the temperature effect on the PD test, the experiment was carried out in a thermostatic laboratory at 23°C, and the temperature of the fiber was monitored by a temperature detector to keep at 22°C–23°C throughout the experiment. The PD test shows that the wavelength offset of the LD pump laser is less than 0.1 nm at 22°C–23°C recording by the YOKOGAWA AQ6370C for 6 h. Long-term power fluctuation of the 633 nm laser power and the 974 nm laser power measured for 6 h is less than 2% and 1%, respectively. The standard stretched exponential function[10] is used to fit measured data, as shown inand the degree of PD can be characterized by the fitting parameters, i.e., the equilibrium loss , the time constant , and the stretching parameter .
In order to determine the degree of inversion under the different 974 nm pump power scale, the numerical simulation of inversion is carried out by MATLAB withwhere the absorption cross section and the emission cross section at the pump wavelength, the launched pump power , and the saturation power . The fiber core cross section is and the fluorescence lifetime is 0.8 ms. Figure 2 shows the average inversion and standard deviation (stdev) of the inversion versus the pump power for a core-pumped, co-doped silica fiber. When the pump wavelength and the tested fiber are fixed, the standard deviation of inversion is less than 1% at pump powers larger than 200 mW[16], and the inversion is approximately fixed at 49%.
Figure 2.(Color online) Average inversion and standard deviation of the inversion versus pump power for a core-pumped co-doped silica fiber.
The induced loss of co-doped silica fiber under different pump powers at 974 nm is shown in Fig. 3. Figure 3(a) is the induced loss using 0.01 mW of 633 nm probe light within 400 min (A to F periods), and the probe power is increased to 1.7 mW after 400 min of testing in the G period. Figure 3(b) is the induced loss using 1.7 mW of 633 nm probe light. The 633 nm laser threshold current is 50 mA, and the corresponding power is 50 μW. In order to obtain a stable 10 μW laser output, a coupler with coupling ratio 99:1 provided by THORLABS TW630R1F1 was fused to the 633 nm laser pigtail, so the stable 10 μW laser was obtained by attenuating 1 mW of 633 nm laser power.
Figure 3.(Color online) Dynamic equilibrium of PD and PB. means PD is stronger than PB: (a) the powers at 633 nm are 0.01 and 1.7 mW; A–G indicate the experimental process, (b) the power at 633 nm is 1.7 mW.
It is found in the A–D test periods of Fig. 3(a) that the induced loss increases with the decrease of the 974 nm pump power and ion inversion. But in the E and F test periods of Fig. 3(a), the induced loss remains constant when the 974 nm pump powers are 20 and 4 mW, i.e., the inversions are 16% and 3%. In contrast, when the 974 nm pump power is kept at 4 mW and the 633 nm probe light is increased to 1.7 mW, as shown in the G period in Fig. 3(a), and the induced loss is rapidly reduced. It is deduced that the PD of the tested fiber is bleached.
A similar result was observed using a 1.7 mW 633 nm probe light in Fig. 3(b). The induced loss continues to increase with the reduction of 974 nm pump power and inversion until the pump power down to 100 mW, as shown in the A–C periods of Fig. 3(b). But the induced loss is reduced when the 974 nm pump powers are 50 and 0 mW, as shown in the D and E periods of Fig. 3(b).
It can be inferred from Fig. 3 that PD is caused by the 974 nm pump light. Both PD and photobleaching (PB) exist in the PD test. When PD is stronger than PB, the induced loss of fiber increases, the fiber is darkened, as shown in the A–D periods of Fig. 3(a) and the A–C periods of Fig. 3(b). When PD is equal to PB, the induced loss of remains constant, as shown in the E and F periods of Fig. 3(a). Furthermore, when PD is weaker than PB, the induced loss of fiber decreases, the fiber is bleached, as shown in the G period of Fig. 3(a) and the D period of Fig. 3(b). Thus, it is confirmed that there is dynamic equilibrium between PD and PB during the PD test in the present test. Further comparative experiments are carried out to determine whether the bleaching process is dominated by the 974 nm pump light or the 633 nm probe light.
First, the induced loss of the tested fiber is measured with different 974 nm pump powers and the results are shown in Fig. 4(a). The inversion increases from 19% to 49% as the pump power increases from 25 to 200 mW, and the inversion is 49% when the pump powers are 200, 220, and 250 mW. It can be seen from Fig. 4(a) that the induced loss increases with the inversion increase, and the induced loss evolution curves almost overlap when the inversion is 49% even if the 974 nm pump power is different. It confirms that PD is mainly determined by inversion, which is consistent with previous studies[6,7].
Figure 4.(Color online) Induced loss at 633 nm: (a) with different 974 nm pump powers, (b) PB with different wavelengths.
If the 974 nm laser has a significant bleaching effect, the induced loss will decrease with the increase of the pump power, provided that the pump power is much larger than the saturated pump power, which is about 100 mW, as indicated in Fig. 2. But the results in Fig. 4(a) show that there is no change of induced loss when the 974 nm pump power increases from 200 to 250 mW. It indicates that the 974 nm pump light has no bleaching effect. To further confirm the bleaching effect of the pump light, two tests fibers with the same length are darkened to the same degree with the same pump power, then the 974 and 633 nm lasers are used to bleach the darkened fibers with the same power; the results are shown in Fig. 4(b). It can be seen from Fig. 4(b) that an obvious bleaching effect can be observed in the 633 nm laser, and the 974 nm laser has almost no bleaching effect. Therefore, the PB mainly results from the 633 nm probe light instead of the 974 nm pump light. It means that the 633 nm probe light bleaches the darkened fiber, while the fiber is darkened by the 974 nm pump light; both PD and PB compete with each other in the PD test. When the PD is stronger than PB, the fiber-induced loss increases, whereas the induced loss decreases. In conclusion, there is dynamic equilibrium between PD induced by 974 nm pump light and PB induced by the 633 nm probe light during the PD test utilizing the 633 nm laser as the probe light.
Due to the existence of the dynamic equilibrium between the darkening effect of the 974 nm pump light and the bleaching effect of the 633 nm probe light in PD test, it is necessary to quantitatively evaluate the effect of the 633 nm laser power on the tested result. In Fig. 5, the induced loss of tested fibers with the same length and 974 nm pump power but different power scales of 633 nm probe light were measured. It is shown that induced loss decreases with the increase of the 633 nm probe power. The fitting parameters at different 633 nm laser powers are listed in Table. 1. It demonstrates that larger 633 nm probe light power results in lower saturated PD loss and time constant. As a result, the power scale of the 633 nm probe light also affects the accuracy of the PD test.
Power of 633 nm laser (mW)
αeq (dB/m)
τ (min)
β
0.01
207
510
0.45
0.62
182
359
0.44
0.99
167
299
0.44
1.7
148
219
0.45
7.3
106
122
0.45
Table 1. Fitting Parameters at Different 633 nm Laser Powers
Figure 6 shows the relation between 633 nm laser power, saturated loss , and time constant . We noticed that the saturated loss is linearly changed if the 633 nm power is less than 1 mW, as shown in insert. In this way, the saturated loss of 207.3 dB/m is obtained by the linear fitting of the tested data at 0 mW of 633 nm probe power. The tested induced loss is reliable when the deviation of the saturated loss is , which corresponds to 0.2 mW 633 nm probe power. That is, when the 633 nm probe light power is less than 0.2 mW, the deviation of the induced loss is less than 5%.
Figure 6.(Color online) Relation between 633 nm laser power and saturated loss, time constant. Insert: a linear fit of the saturated loss.
Figure 7 is the two-dimensional hyperfine sublevel correlation (2D-HYSCORE) spectrum of the co-doped silica fiber preform core glass. It was recorded at 4 K using a Brüker E-580 BRUKER ELEXSYS X-band pulsed-EPR spectrometer operating at 9.251 GHz. The time delay of the pulse sequence echo is 100 ns and the static magnetic field was chosen at 450 mT. The HYSCORE spectrum of the preform core glass reveals an intense pattern around 4.996 and 3.81 MHz, corresponding to the Larmor frequencies of and , respectively. Figure 7 clearly indicates that ions are surrounded by both and ions in this co-doped silica glass.
Figure 7.2D-HYSCORE spectrum of the co-doped silica fiber preform.
The dynamic equilibrium of PD of co-doped silica fiber is the balancing process of color center formation and annihilation. Previous studies show that under ultraviolet light (196 nm) or near-infrared light irradiation, the absorption band of 400–700 nm of the Yb-doped silica fiber is caused by an aluminum-oxide hole center (Al-OHC)[17]. Moreover, Sen et al.[18,19] supported that ions in the aluminosilicate glass are surrounded by and tetrahedral. is negatively charged and easily captures positively charged holes; the following inverse photochemical reaction process may occur in when both 974 nm pump light and 633 nm probe light exist:
The 974 nm pump light promotes the color center formation according to Eq. (3). On the other hand, the 633 nm probe light encourages the color center annihilation. When PD is stronger than PB, the number of Al-OHC in the fiber increases according to Eq. (3), resulting in an increased absorption at 633 nm. If the 974 nm power is low enough, due to instability of [20,21], it is easy to release electrons in the 633 nm laser excitation, which are captured by Al-OHC, resulting in a decrease in the number of color centers and decreased absorption at 633 nm. It is in good agreement with the observed induced loss curve in Fig. 3.
In the PD test, increase of 633 nm laser power promotes a photochemical reaction toward the reduction of color center. At the same time, the large 633 nm power accelerates the reaction and shortens the reaction time to reach the equilibrium state. As a result, a lower saturated PD loss and time constant are obtained with a higher 633 nm probe light power, as shown in Table 1.
The induced loss curve is the result of the superposition of the PD effect induced by 974 nm pump power and PB effect induced by 633 nm probe light. The equilibrium loss is the result of the equilibrium of the PD and PB processes. The induced loss increases or decreases when the two inverse processes do not reach equilibrium, and the induced loss will remain constant when the equilibrium is reached. Therefore, 633 nm probe light with lower power (less than 0.2 mW) is suggested for the improvement of the PD test accuracy of the -doped silica fiber.
In conclusion, the role of 633 nm probe light and 974 nm pump light in the PD test of co-doped silica fiber is analyzed. The results show that there is dynamic equilibrium between PD and PB during the test. The bleaching process is dominated by the 633 nm probe light and the darkening process is caused by the 974 nm pump light. In addition, the influence of the 633 nm probe light power on PD is studied quantitatively, and it is found that the higher the 633 nm laser power, the lower the accuracy of the PD test. It is suggested that as long as the 633 nm probe light power is less than 0.2 mW, the deviation of the tested induced loss is less than 5%. The studies show that the PD measurement mode and the PB mode can be switched by selecting the appropriate 633 nm power scale, which is helpful for the parameter design of the integrated device that combines both PD measurement and PB.
References
[1] E. Shcherbakov, V. Fomin, A. Abramov, A. Ferin, D. Mochalov, V. P. Gapontsev. Advanced Solid-State Lasers Congress, ATh4A.2(2013).
Fenghou Xie, Chongyun Shao, Fengguang Lou, Meng Wang, Chunlei Yu, Suya Feng, Lili Hu, "Effect of power scale of 974 and 633 nm lasers on the induced loss at 633 nm of Yb3+/Al3+ co-doped silica fiber," Chin. Opt. Lett. 16, 010603 (2018)