
Zhengwei Yang, Zhibin Zhao, Jianguo Gao, Guangjie Kou, Wei Zhang. Evaluation of infrared thermal wave detection capability for delamination damage of thermosetting/thermoplastic composites[J]. Infrared and Laser Engineering, 2021, 50(S2): 20210304
- Infrared and Laser Engineering
- Vol. 50, Issue S2, 20210304 (2021)
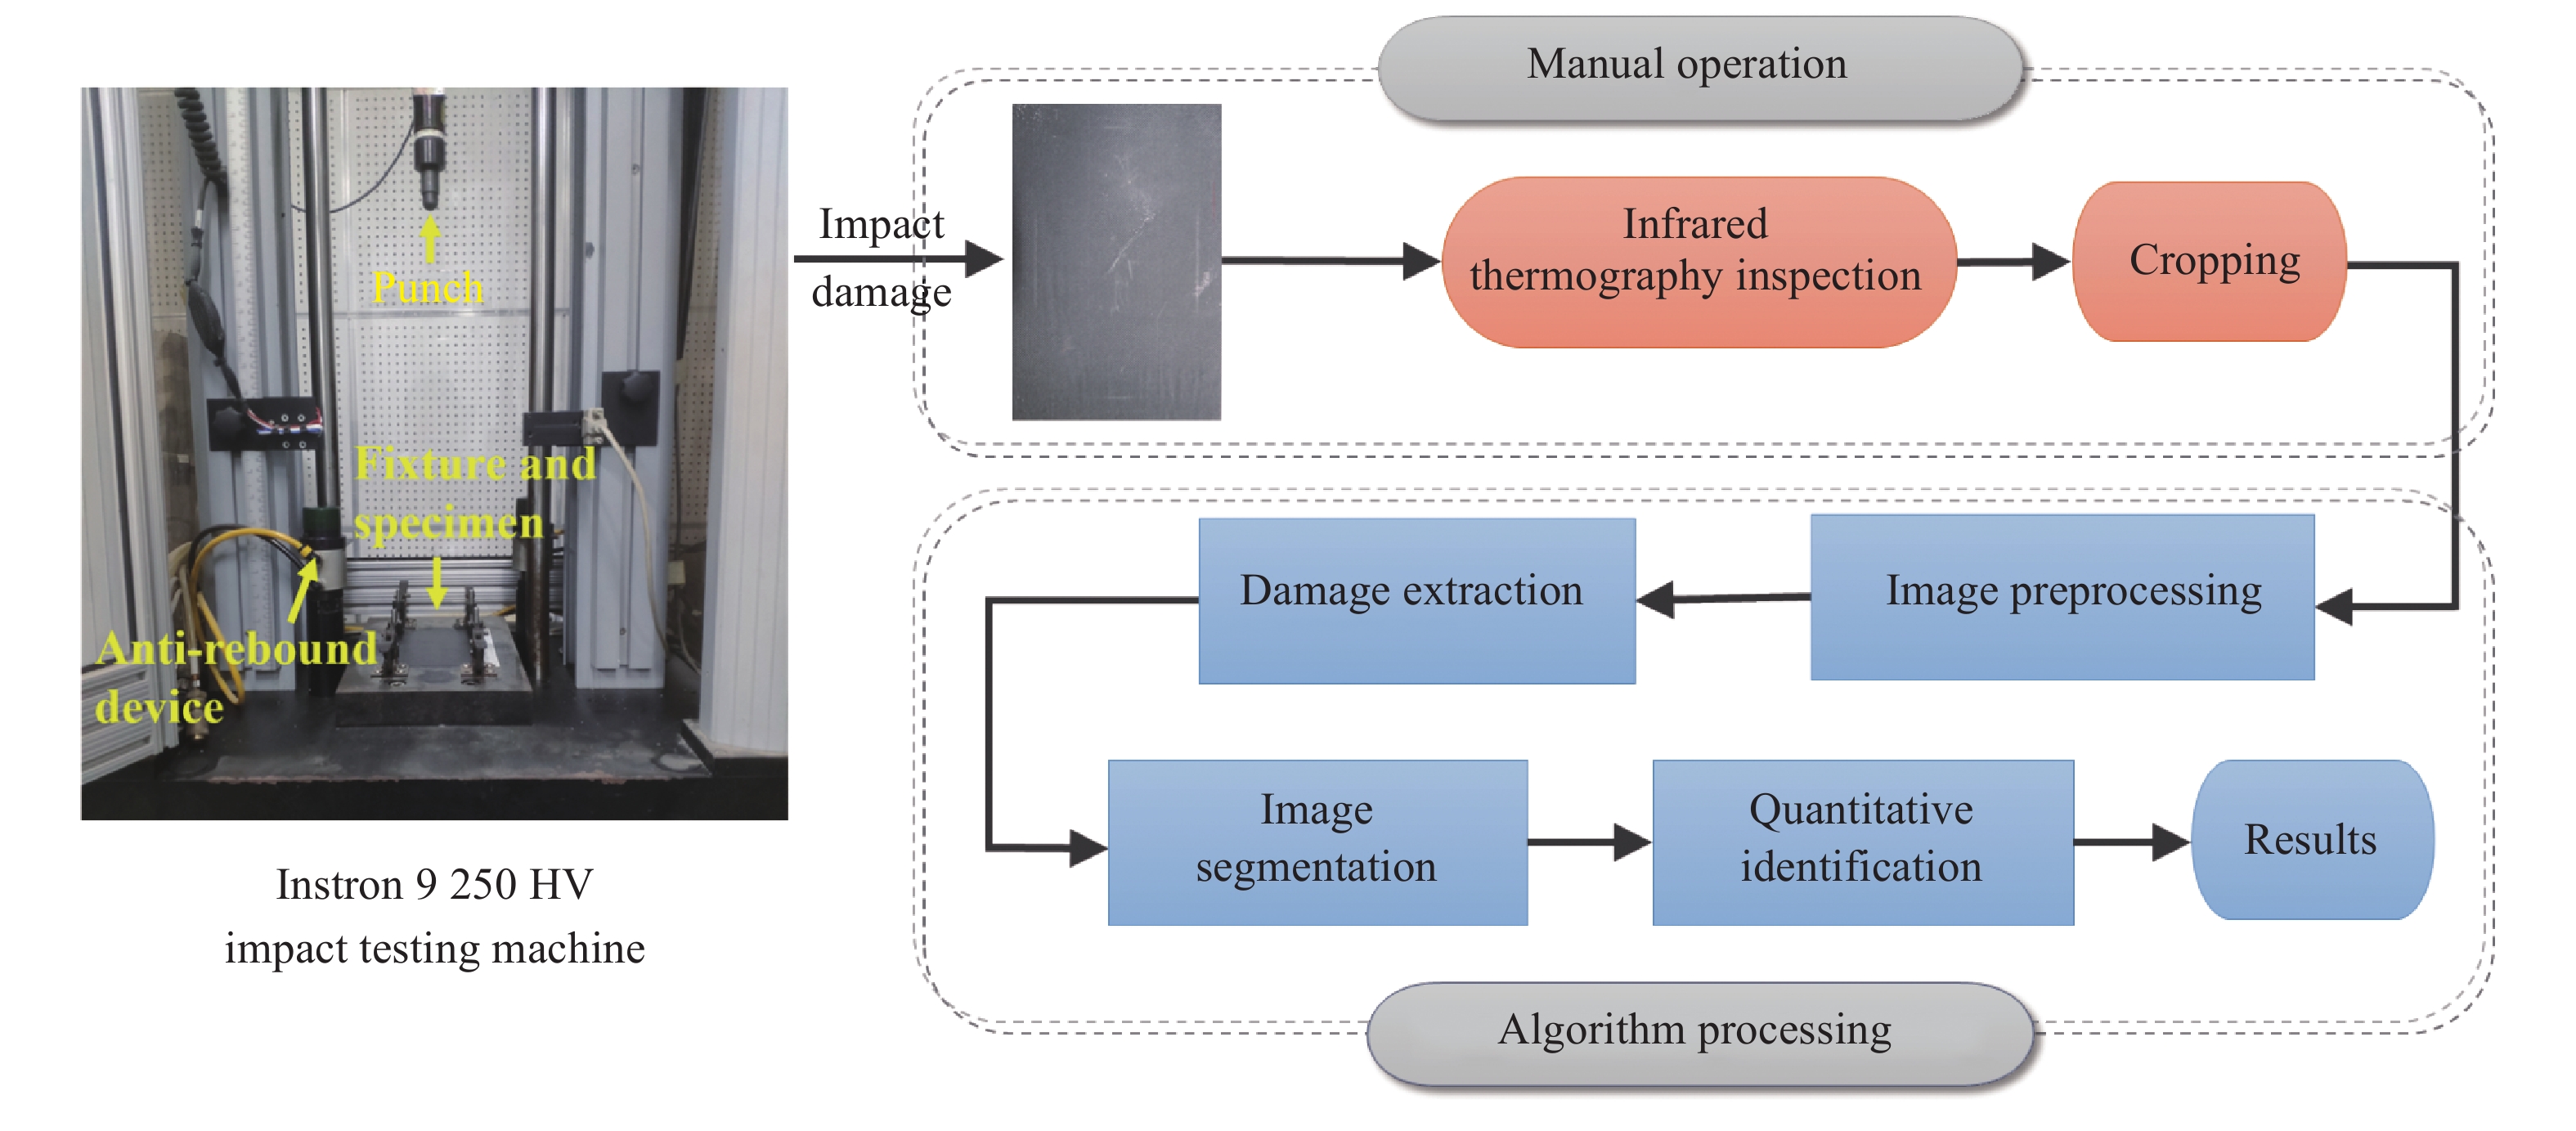
Fig. 1. Test and thermal map processing flow chart
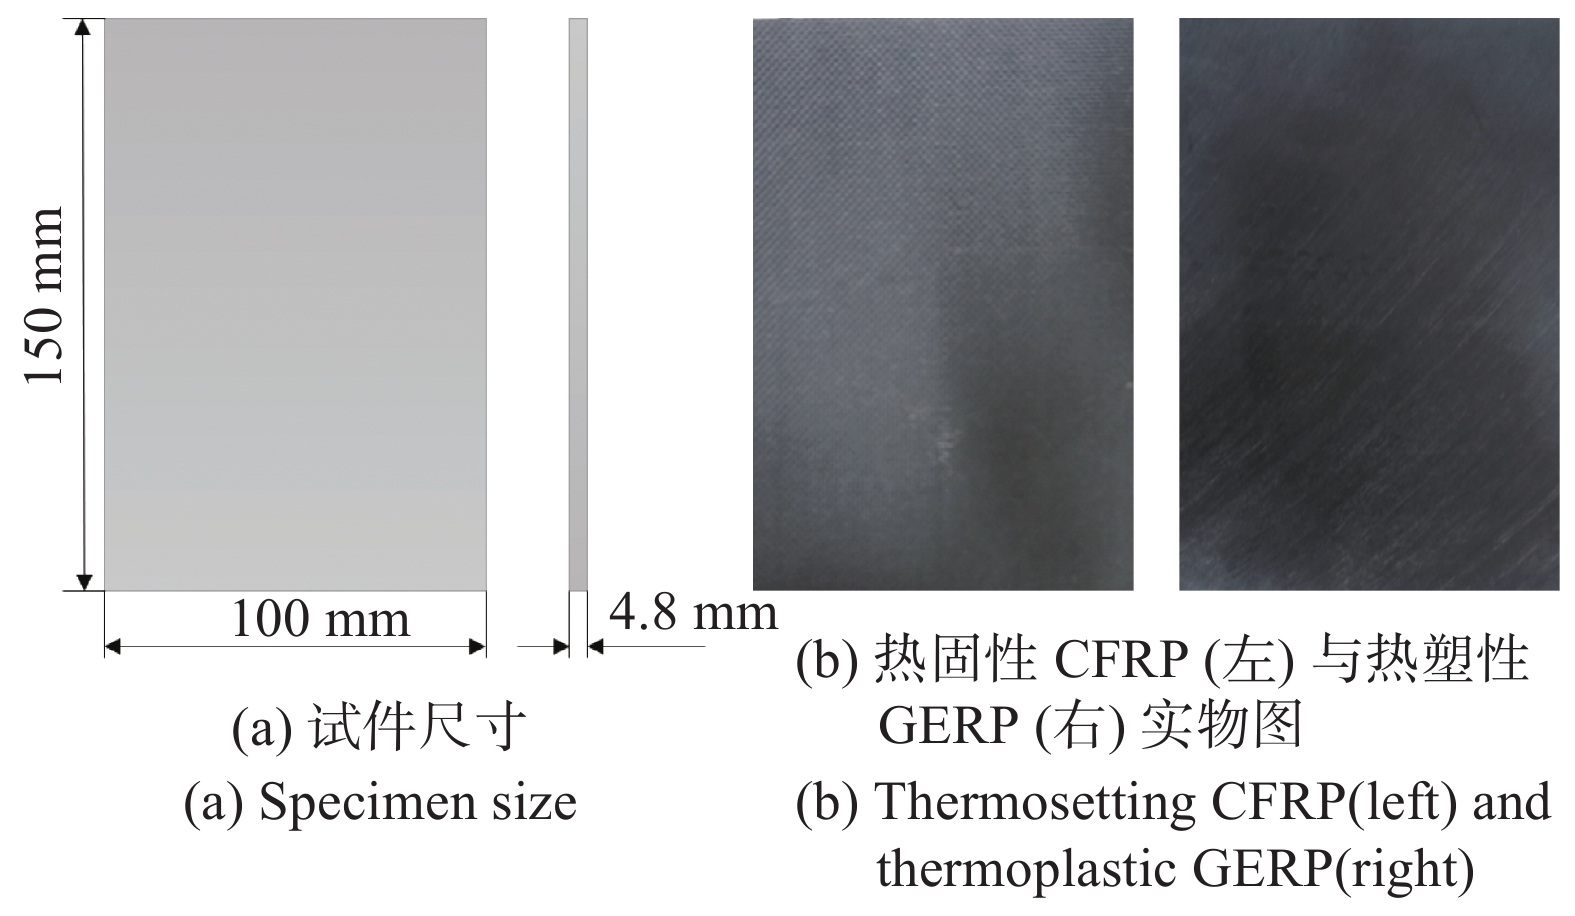
Fig. 2. Testing specimen
Fig. 3. Dynamic curve of impact response parameters with time
Fig. 4. Test results of 1#-4# specimen by ultrasonic C-scan
Fig. 5. Infrared thermal wave detection schematic diagram
Fig. 6. Active infrared thermal wave detection system
Fig. 7. Test results of 1# specimen (TS-15J) by pulse thermography
Fig. 8. Test results of 3# specimen (TP-15J) by pulse thermography
Fig. 9. Test results of 2# specimen (TS-30J) by pulse thermography
Fig. 10. Test results of 4# specimen (TP-30J) by pulse thermography
Fig. 11. Temperature change of 1# specimen after pulse excitation
Fig. 12. Test results of 1# specimen (TS-15J) by ultrasonic thermalgraphy
Fig. 13. Test results of 3# specimen (TP-15J) by ultrasonic thermalgraphy
Fig. 14. Test results of 2# specimen (TS-30J) by ultrasonic thermalgraphy
Fig. 15. Test results of 4# specimen (TP-30J) by ultrasonic thermalgraphy
Fig. 16. Time sequence change characteristics of 1#-4# specimen
Fig. 17. Schematic diagram of region growing algorithm
Fig. 18. Extraction and segmentation results of heat image damage by pulse infrared detection
Fig. 19. Extraction and segmentation results of heat image damage by pulse uitrasonic infrared detection
| |||||||||||||||||||||||||||||||||||||
Table 1. The delamination damage area and its relative error of TP/TS specimens under pulse/ultrasonic detection method

Set citation alerts for the article
Please enter your email address
© Copyright 2018-2021 | Chinese Laser Press. All Rights Reserved 沪ICP备15018463号-20